


Thank you to the Center for Regional Economic Competitiveness (CREC), BrightHive, and UMass Amherst College of Social & Behavioral Sciences for their work to develop the Empowerment Score. A special thanks to Colorado’s Workforce Intelligence Data Experts (WIDE) group and community stakeholders throughout Colorado for sharing their insights and experiences to strengthen the score and ensure it was applicable to local Colorado communities.

Empowering Colorado, One County at a Time
The Empowerment Score aims to measure individual, community, and economic characteristics that lead to greater employment stability and increased wages for Colorado workers.
- Leader
- On-Track
- Opportunity
Please select a County to view its Empowerment scores.
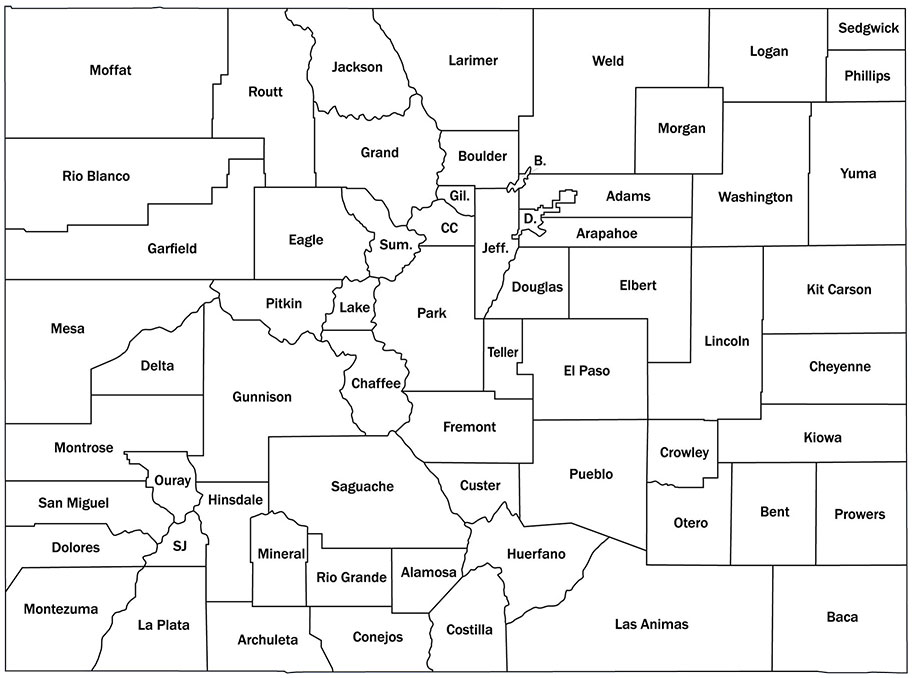
- Moffat
- Routt
- Jackson
- Larimer
- Weld
- Logan
- Sedgwick
- Phillips
- Morgan
- B.
- Boulder
- Grand
- Rio Blanco
- Garfield
- Eagle
- Sum.
- CC.
- Gil.
- Jeff.
- D.
- Adams
- Arapahoe
- Washington
- Yuma
- Mesa
- Delta
- Montrose
- San Miguel
- Ouray
- Pitkin
- Lake
- Gunnison
- Dolores
- Montezuma
- La Plata
- SJ
- Archuleta
- Hinsdale
- Mineral
- Chaffee
- Park
- Douglas
- Teller
- Fremont
- Saguache
- Rio Grande
- Conejos
- Alamosa
- Costilla
- Huerfano
- Custer
- Las Animas
- Pueblo
- El Paso
- Elbert
- Lincoln
- Crowley
- Otero
- Kit Carson
- Cheyenne
- Kiowa
- Bent
- Prowers
- Baca
- Northwest Colorado
- Rocky Mountain Resort
- Northern Colorado
- Golden Plains
- Central Western Slope
- Southwest
- Upper Arkansas
- San Luis Valley
- Denver Region
- Pikes Peak
- Central Plains
- Raton Basis
- Pueblo
- Southeast Colorado
| County Name | individual | neighborhood | industry | regional_job_opportunities | regional_context | education_training | engagement | combined_score |
|---|---|---|---|---|---|---|---|---|
| Adams | 94.607275136452 | 110.09717467633 | 147.15330319205 | 66.151339958307 | 176.71787494652 | 193.44445969274 | 117.29592286269 | 129.35247863787 |
| Arapahoe | 110.8399763001 | 110.5533192391 | 156.46348586145 | 66.151339958307 | 176.71787494652 | 193.44445969274 | 106.31610466892 | 131.49808009531 |
| Boulder | 107.49013418846 | 120.17538431992 | 132.03032617831 | 66.151339958307 | 176.71787494652 | 193.44445969274 | 125.74046197017 | 131.67856875063 |
| Broomfield | 119.81949481153 | 121.66488895206 | 127.62334540178 | 66.151339958307 | 176.71787494652 | 193.44445969274 | 124.21634316507 | 132.80539241829 |
| Clear Creek | 135.63709731485 | 106.69244242612 | 83.773977834664 | 66.151339958307 | 176.71787494652 | 193.44445969274 | 97.670429060392 | 122.86966017623 |
| Denver | 96.100695539668 | 113.44611683129 | 173.7331291566 | 66.151339958307 | 176.71787494652 | 193.44445969274 | 106.46180408237 | 132.29363145821 |
| Douglas | 120.94243995439 | 128.73229759493 | 120.45159029865 | 66.151339958307 | 176.71787494652 | 193.44445969274 | 132.68703292824 | 134.1610050534 |
| Gilpin | 122.40428598423 | 133.50616815328 | 103.87893387679 | 66.151339958307 | 176.71787494652 | 193.44445969274 | 82.603616783773 | 125.52952562795 |
| Jefferson | 118.61522509899 | 108.15787462385 | 135.86757263101 | 66.151339958307 | 176.71787494652 | 193.44445969274 | 142.69566594113 | 134.52143041322 |
| Alamosa | 114.00631663849 | 99.676186295868 | 137.54819981359 | 148.68886286218 | 17.777931143704 | 174.28698301625 | 114.18119475434 | 115.16652493206 |
| Conejos | 122.95128628384 | 74.483268666372 | 56.018626294761 | 148.68886286218 | 17.777931143704 | 174.28698301625 | 76.914210185691 | 95.874452636115 |
| Costilla | 101.6349393396 | 75.69437296608 | 76.122738680729 | 148.68886286218 | 17.777931143704 | 174.28698301625 | 59.175659299497 | 93.340212472578 |
| Mineral | 57.332618947642 | 101.82918722343 | 80.010900763323 | 148.68886286218 | 17.777931143704 | 174.28698301625 | 1.8407194262097 | 83.109600483249 |
| Rio Grande | 89.348954558884 | 89.679031827074 | 74.869619265947 | 148.68886286218 | 17.777931143704 | 174.28698301625 | 104.21831953059 | 99.838528886377 |
| Saguache | 83.508192944352 | 87.705801600272 | 62.604207203038 | 148.68886286218 | 17.777931143704 | 174.28698301625 | 68.211609246262 | 91.826226859438 |
| Archuleta | 113.8440487689 | 98.9777462741 | 94.379681020588 | 68.850339776203 | 112.16972196859 | 21.899181659034 | 48.205720597093 | 79.760920009215 |
| Dolores | 123.24741420159 | 103.95140760705 | 71.852159035278 | 68.850339776203 | 112.16972196859 | 21.899181659034 | 94.319934097915 | 85.184308335094 |
| La Plata | 136.2865818062 | 113.34572784804 | 108.62437094071 | 68.850339776203 | 112.16972196859 | 21.899181659034 | 83.966533627713 | 92.163208232355 |
| Montezuma | 117.0036637209 | 90.975439794733 | 111.63428103959 | 68.850339776203 | 112.16972196859 | 21.899181659034 | 82.479076741261 | 86.430243528617 |
| San Juan | 46.165205305804 | 118.88236197086 | 84.435046518569 | 68.850339776203 | 112.16972196859 | 21.899181659034 | 103.46111018721 | 79.408995340897 |
| Baca | 97.968308425607 | 99.372769300176 | 45.43486655923 | 144.3321870202 | 4.4531175314146 | 145.73137662265 | 98.828861571686 | 90.874498147281 |
| Bent | 58.831389455124 | 80.045854040403 | 82.673176669113 | 144.3321870202 | 4.4531175314146 | 145.73137662265 | 132.47694115824 | 92.649148928164 |
| Crowley | 103.18461030595 | 66.652146872283 | 81.462450489608 | 144.3321870202 | 4.4531175314146 | 145.73137662265 | 98.637461601471 | 92.064764349082 |
| Kiowa | 113.00661783724 | 100.93990943901 | 90.904548023358 | 144.3321870202 | 4.4531175314146 | 145.73137662265 | 132.20228470422 | 104.51000588259 |
| Otero | 89.090931074109 | 88.22686211058 | 98.418455769909 | 144.3321870202 | 4.4531175314146 | 145.73137662265 | 134.67009019394 | 100.70328861754 |
| Prowers | 94.375372591875 | 92.885349839692 | 103.71302025261 | 144.3321870202 | 4.4531175314146 | 145.73137662265 | 152.33712062768 | 105.40393492659 |
| Chaffee | 106.73035699865 | 96.741784770998 | 107.2183964315 | 73.719074202173 | 91.221687670605 | 0 | 104.48891606937 | 82.8743165919 |
| Custer | 119.57936843987 | 89.428781238627 | 54.171683537071 | 73.719074202173 | 91.221687670605 | 0 | 52.689576075829 | 68.687167309167 |
| Fremont | 140.80932999823 | 86.569675422629 | 93.827891332362 | 73.719074202173 | 91.221687670605 | 0 | 109.46160136591 | 85.087037141701 |
| Lake | 71.364220840806 | 89.831670696153 | 84.346901265108 | 73.719074202173 | 91.221687670605 | 0 | 57.193670535088 | 66.811032172848 |
| Cheyenne | 130.96873271888 | 83.767099001386 | 52.802474412052 | 71.369084819864 | 113.64558858286 | 0 | 94.035247547713 | 78.084032440394 |
| Elbert | 112.78228475771 | 107.64039235142 | 67.141054409642 | 71.369084819864 | 113.64558858286 | 0 | 130.26322899692 | 86.120233416916 |
| Kit Carson | 118.89008047307 | 101.41769181117 | 93.473934758806 | 71.369084819864 | 113.64558858286 | 0 | 107.71572115935 | 86.644585943588 |
| Lincoln | 37.180874218994 | 83.269001286097 | 109.9549096447 | 71.369084819864 | 113.64558858286 | 0 | 86.708962554879 | 71.732631586771 |
| Delta | 131.84929437191 | 86.770089763484 | 91.425138467515 | 119.85406659605 | 112.54667125801 | 24.736362724562 | 124.31182386441 | 98.78477814942 |
| Gunnison | 118.25973993623 | 114.42869708983 | 106.3974892517 | 119.85406659605 | 112.54667125801 | 24.736362724562 | 86.212306730419 | 97.490761940971 |
| Hinsdale | 45.937945424146 | 76.143568952806 | 81.24958414794 | 119.85406659605 | 112.54667125801 | 24.736362724562 | 18.349553055412 | 68.402536022704 |
| Montrose | 104.5125831072 | 93.336681102292 | 112.65116236812 | 119.85406659605 | 112.54667125801 | 24.736362724562 | 135.7238922044 | 100.48020276581 |
| Ouray | 119.46605710696 | 104.3654566804 | 107.54162658583 | 119.85406659605 | 112.54667125801 | 24.736362724562 | 130.28642634166 | 102.68523818478 |
| San Miguel | 55.447822082005 | 111.98824165521 | 110.36220766566 | 119.85406659605 | 112.54667125801 | 24.736362724562 | 56.226291727287 | 84.451666244112 |
| Eagle | 79.17285830495 | 113.93440853433 | 121.48855802124 | 99.069112450835 | 190.97732783913 | 0 | 57.354509879574 | 94.570967861436 |
| Grand | 120.21418567603 | 108.54847838546 | 99.854253159918 | 99.069112450835 | 190.97732783913 | 0 | 57.114210760613 | 96.539652610284 |
| Jackson | 133.03524944994 | 84.155376486734 | 72.976169302592 | 99.069112450835 | 190.97732783913 | 0 | 147.25755409678 | 103.924398518 |
| Pitkin | 86.792947079056 | 100.25087267941 | 126.03714873081 | 99.069112450835 | 190.97732783913 | 0 | 56.740381431659 | 94.266827172985 |
| Summit | 93.315615313573 | 115.72985286538 | 119.55384444148 | 99.069112450835 | 190.97732783913 | 0 | 32.566493143075 | 93.030320864781 |
| El Paso | 117.31169010296 | 111.36392367677 | 144.63887179261 | 59.417203768588 | 151.24123659018 | 65.15477048933 | 108.74968355539 | 108.2681971394 |
| Park | 102.3245498257 | 94.816032776345 | 75.133804609629 | 59.417203768588 | 151.24123659018 | 65.15477048933 | 68.077880998997 | 88.02363986554 |
| Teller | 102.57793309451 | 105.82294650592 | 96.243088245152 | 59.417203768588 | 151.24123659018 | 65.15477048933 | 101.33985623665 | 97.399576418618 |
| Garfield | 63.931190872527 | 98.505003001515 | 115.60506243996 | 104.64671724365 | 99.729359059507 | 103.97729296803 | 88.757493678323 | 96.450302751932 |
| Mesa | 144.46252992441 | 105.13425417172 | 131.16739678851 | 104.64671724365 | 99.729359059507 | 103.97729296803 | 135.1976224426 | 117.7593103712 |
| Moffat | 70.966225487895 | 107.04209118599 | 90.985141012377 | 104.64671724365 | 99.729359059507 | 103.97729296803 | 117.00778411686 | 99.193515867759 |
| Rio Blanco | 80.905371798221 | 84.670542726814 | 84.900084227922 | 104.64671724365 | 99.729359059507 | 103.97729296803 | 86.750201271304 | 92.225652756493 |
| Routt | 102.24396553711 | 112.58286459394 | 109.38718119506 | 104.64671724365 | 99.729359059507 | 103.97729296803 | 91.459767303226 | 103.43244970008 |
| Huerfano | 118.32957819718 | 102.74564373615 | 77.073434312206 | 114.08250170372 | 38.343582943623 | 281.8572706195 | 73.352598197245 | 115.11208710138 |
| Las Animas | 87.468019110999 | 83.4656698995 | 117.79905490446 | 114.08250170372 | 38.343582943623 | 281.8572706195 | 84.805983743594 | 115.40315470363 |
| Larimer | 113.78800302586 | 120.37249596692 | 135.58810805151 | 102.86094501226 | 158.25873178184 | 39.269220575047 | 127.2589842207 | 113.91378409059 |
| Weld | 98.280364373482 | 111.67771994841 | 131.23190108589 | 102.86094501226 | 158.25873178184 | 39.269220575047 | 141.58390077587 | 111.8803976504 |
| Logan | 67.245169151591 | 104.78465645358 | 90.836267048335 | 118.77648488107 | 91.396217679998 | 178.04285914933 | 109.38580765973 | 108.63820886052 |
| Morgan | 46.640121114765 | 97.902810698749 | 100.90336900039 | 118.77648488107 | 91.396217679998 | 178.04285914933 | 107.93809989877 | 105.94285177473 |
| Phillips | 105.66173400647 | 105.59621204194 | 72.020552925529 | 118.77648488107 | 91.396217679998 | 178.04285914933 | 183.90068737474 | 122.19924972273 |
| Sedgwick | 25.009878613574 | 81.894670921246 | 83.34005727305 | 118.77648488107 | 91.396217679998 | 178.04285914933 | 130.47327948843 | 101.2762068581 |
| Washington | 115.33003442337 | 102.61820194956 | 50.460822866299 | 118.77648488107 | 91.396217679998 | 178.04285914933 | 119.60424344742 | 110.88983777101 |
| Yuma | 125.09251905506 | 91.349252810343 | 84.79337738163 | 118.77648488107 | 91.396217679998 | 178.04285914933 | 150.24245897124 | 119.95616713267 |
| Pueblo | 97.878499451333 | 92.988095667886 | 153.73598413417 | 108.1820797049 | 41.52095100402 | 171.60022248351 | 107.59907006479 | 110.50070035866 |
Lincoln County Empowerment Profile
| County Name | individual | neighborhood | industry | regional_job_opportunities | regional_context | education_training | engagement | combined_score |
|---|---|---|---|---|---|---|---|---|
| Adams | 94.607275136452 | 110.09717467633 | 147.15330319205 | 66.151339958307 | 176.71787494652 | 193.44445969274 | 117.29592286269 | 129.35247863787 |
| Arapahoe | 110.8399763001 | 110.5533192391 | 156.46348586145 | 66.151339958307 | 176.71787494652 | 193.44445969274 | 106.31610466892 | 131.49808009531 |
| Boulder | 107.49013418846 | 120.17538431992 | 132.03032617831 | 66.151339958307 | 176.71787494652 | 193.44445969274 | 125.74046197017 | 131.67856875063 |
| Broomfield | 119.81949481153 | 121.66488895206 | 127.62334540178 | 66.151339958307 | 176.71787494652 | 193.44445969274 | 124.21634316507 | 132.80539241829 |
| Clear Creek | 135.63709731485 | 106.69244242612 | 83.773977834664 | 66.151339958307 | 176.71787494652 | 193.44445969274 | 97.670429060392 | 122.86966017623 |
| Denver | 96.100695539668 | 113.44611683129 | 173.7331291566 | 66.151339958307 | 176.71787494652 | 193.44445969274 | 106.46180408237 | 132.29363145821 |
| Douglas | 120.94243995439 | 128.73229759493 | 120.45159029865 | 66.151339958307 | 176.71787494652 | 193.44445969274 | 132.68703292824 | 134.1610050534 |
| Gilpin | 122.40428598423 | 133.50616815328 | 103.87893387679 | 66.151339958307 | 176.71787494652 | 193.44445969274 | 82.603616783773 | 125.52952562795 |
| Jefferson | 118.61522509899 | 108.15787462385 | 135.86757263101 | 66.151339958307 | 176.71787494652 | 193.44445969274 | 142.69566594113 | 134.52143041322 |
| Alamosa | 114.00631663849 | 99.676186295868 | 137.54819981359 | 148.68886286218 | 17.777931143704 | 174.28698301625 | 114.18119475434 | 115.16652493206 |
| Conejos | 122.95128628384 | 74.483268666372 | 56.018626294761 | 148.68886286218 | 17.777931143704 | 174.28698301625 | 76.914210185691 | 95.874452636115 |
| Costilla | 101.6349393396 | 75.69437296608 | 76.122738680729 | 148.68886286218 | 17.777931143704 | 174.28698301625 | 59.175659299497 | 93.340212472578 |
| Mineral | 57.332618947642 | 101.82918722343 | 80.010900763323 | 148.68886286218 | 17.777931143704 | 174.28698301625 | 1.8407194262097 | 83.109600483249 |
| Rio Grande | 89.348954558884 | 89.679031827074 | 74.869619265947 | 148.68886286218 | 17.777931143704 | 174.28698301625 | 104.21831953059 | 99.838528886377 |
| Saguache | 83.508192944352 | 87.705801600272 | 62.604207203038 | 148.68886286218 | 17.777931143704 | 174.28698301625 | 68.211609246262 | 91.826226859438 |
| Archuleta | 113.8440487689 | 98.9777462741 | 94.379681020588 | 68.850339776203 | 112.16972196859 | 21.899181659034 | 48.205720597093 | 79.760920009215 |
| Dolores | 123.24741420159 | 103.95140760705 | 71.852159035278 | 68.850339776203 | 112.16972196859 | 21.899181659034 | 94.319934097915 | 85.184308335094 |
| La Plata | 136.2865818062 | 113.34572784804 | 108.62437094071 | 68.850339776203 | 112.16972196859 | 21.899181659034 | 83.966533627713 | 92.163208232355 |
| Montezuma | 117.0036637209 | 90.975439794733 | 111.63428103959 | 68.850339776203 | 112.16972196859 | 21.899181659034 | 82.479076741261 | 86.430243528617 |
| San Juan | 46.165205305804 | 118.88236197086 | 84.435046518569 | 68.850339776203 | 112.16972196859 | 21.899181659034 | 103.46111018721 | 79.408995340897 |
| Baca | 97.968308425607 | 99.372769300176 | 45.43486655923 | 144.3321870202 | 4.4531175314146 | 145.73137662265 | 98.828861571686 | 90.874498147281 |
| Bent | 58.831389455124 | 80.045854040403 | 82.673176669113 | 144.3321870202 | 4.4531175314146 | 145.73137662265 | 132.47694115824 | 92.649148928164 |
| Crowley | 103.18461030595 | 66.652146872283 | 81.462450489608 | 144.3321870202 | 4.4531175314146 | 145.73137662265 | 98.637461601471 | 92.064764349082 |
| Kiowa | 113.00661783724 | 100.93990943901 | 90.904548023358 | 144.3321870202 | 4.4531175314146 | 145.73137662265 | 132.20228470422 | 104.51000588259 |
| Otero | 89.090931074109 | 88.22686211058 | 98.418455769909 | 144.3321870202 | 4.4531175314146 | 145.73137662265 | 134.67009019394 | 100.70328861754 |
| Prowers | 94.375372591875 | 92.885349839692 | 103.71302025261 | 144.3321870202 | 4.4531175314146 | 145.73137662265 | 152.33712062768 | 105.40393492659 |
| Chaffee | 106.73035699865 | 96.741784770998 | 107.2183964315 | 73.719074202173 | 91.221687670605 | 0 | 104.48891606937 | 82.8743165919 |
| Custer | 119.57936843987 | 89.428781238627 | 54.171683537071 | 73.719074202173 | 91.221687670605 | 0 | 52.689576075829 | 68.687167309167 |
| Fremont | 140.80932999823 | 86.569675422629 | 93.827891332362 | 73.719074202173 | 91.221687670605 | 0 | 109.46160136591 | 85.087037141701 |
| Lake | 71.364220840806 | 89.831670696153 | 84.346901265108 | 73.719074202173 | 91.221687670605 | 0 | 57.193670535088 | 66.811032172848 |
| Cheyenne | 130.96873271888 | 83.767099001386 | 52.802474412052 | 71.369084819864 | 113.64558858286 | 0 | 94.035247547713 | 78.084032440394 |
| Elbert | 112.78228475771 | 107.64039235142 | 67.141054409642 | 71.369084819864 | 113.64558858286 | 0 | 130.26322899692 | 86.120233416916 |
| Kit Carson | 118.89008047307 | 101.41769181117 | 93.473934758806 | 71.369084819864 | 113.64558858286 | 0 | 107.71572115935 | 86.644585943588 |
| Lincoln | 37.180874218994 | 83.269001286097 | 109.9549096447 | 71.369084819864 | 113.64558858286 | 0 | 86.708962554879 | 71.732631586771 |
| Delta | 131.84929437191 | 86.770089763484 | 91.425138467515 | 119.85406659605 | 112.54667125801 | 24.736362724562 | 124.31182386441 | 98.78477814942 |
| Gunnison | 118.25973993623 | 114.42869708983 | 106.3974892517 | 119.85406659605 | 112.54667125801 | 24.736362724562 | 86.212306730419 | 97.490761940971 |
| Hinsdale | 45.937945424146 | 76.143568952806 | 81.24958414794 | 119.85406659605 | 112.54667125801 | 24.736362724562 | 18.349553055412 | 68.402536022704 |
| Montrose | 104.5125831072 | 93.336681102292 | 112.65116236812 | 119.85406659605 | 112.54667125801 | 24.736362724562 | 135.7238922044 | 100.48020276581 |
| Ouray | 119.46605710696 | 104.3654566804 | 107.54162658583 | 119.85406659605 | 112.54667125801 | 24.736362724562 | 130.28642634166 | 102.68523818478 |
| San Miguel | 55.447822082005 | 111.98824165521 | 110.36220766566 | 119.85406659605 | 112.54667125801 | 24.736362724562 | 56.226291727287 | 84.451666244112 |
| Eagle | 79.17285830495 | 113.93440853433 | 121.48855802124 | 99.069112450835 | 190.97732783913 | 0 | 57.354509879574 | 94.570967861436 |
| Grand | 120.21418567603 | 108.54847838546 | 99.854253159918 | 99.069112450835 | 190.97732783913 | 0 | 57.114210760613 | 96.539652610284 |
| Jackson | 133.03524944994 | 84.155376486734 | 72.976169302592 | 99.069112450835 | 190.97732783913 | 0 | 147.25755409678 | 103.924398518 |
| Pitkin | 86.792947079056 | 100.25087267941 | 126.03714873081 | 99.069112450835 | 190.97732783913 | 0 | 56.740381431659 | 94.266827172985 |
| Summit | 93.315615313573 | 115.72985286538 | 119.55384444148 | 99.069112450835 | 190.97732783913 | 0 | 32.566493143075 | 93.030320864781 |
| El Paso | 117.31169010296 | 111.36392367677 | 144.63887179261 | 59.417203768588 | 151.24123659018 | 65.15477048933 | 108.74968355539 | 108.2681971394 |
| Park | 102.3245498257 | 94.816032776345 | 75.133804609629 | 59.417203768588 | 151.24123659018 | 65.15477048933 | 68.077880998997 | 88.02363986554 |
| Teller | 102.57793309451 | 105.82294650592 | 96.243088245152 | 59.417203768588 | 151.24123659018 | 65.15477048933 | 101.33985623665 | 97.399576418618 |
| Garfield | 63.931190872527 | 98.505003001515 | 115.60506243996 | 104.64671724365 | 99.729359059507 | 103.97729296803 | 88.757493678323 | 96.450302751932 |
| Mesa | 144.46252992441 | 105.13425417172 | 131.16739678851 | 104.64671724365 | 99.729359059507 | 103.97729296803 | 135.1976224426 | 117.7593103712 |
| Moffat | 70.966225487895 | 107.04209118599 | 90.985141012377 | 104.64671724365 | 99.729359059507 | 103.97729296803 | 117.00778411686 | 99.193515867759 |
| Rio Blanco | 80.905371798221 | 84.670542726814 | 84.900084227922 | 104.64671724365 | 99.729359059507 | 103.97729296803 | 86.750201271304 | 92.225652756493 |
| Routt | 102.24396553711 | 112.58286459394 | 109.38718119506 | 104.64671724365 | 99.729359059507 | 103.97729296803 | 91.459767303226 | 103.43244970008 |
| Huerfano | 118.32957819718 | 102.74564373615 | 77.073434312206 | 114.08250170372 | 38.343582943623 | 281.8572706195 | 73.352598197245 | 115.11208710138 |
| Las Animas | 87.468019110999 | 83.4656698995 | 117.79905490446 | 114.08250170372 | 38.343582943623 | 281.8572706195 | 84.805983743594 | 115.40315470363 |
| Larimer | 113.78800302586 | 120.37249596692 | 135.58810805151 | 102.86094501226 | 158.25873178184 | 39.269220575047 | 127.2589842207 | 113.91378409059 |
| Weld | 98.280364373482 | 111.67771994841 | 131.23190108589 | 102.86094501226 | 158.25873178184 | 39.269220575047 | 141.58390077587 | 111.8803976504 |
| Logan | 67.245169151591 | 104.78465645358 | 90.836267048335 | 118.77648488107 | 91.396217679998 | 178.04285914933 | 109.38580765973 | 108.63820886052 |
| Morgan | 46.640121114765 | 97.902810698749 | 100.90336900039 | 118.77648488107 | 91.396217679998 | 178.04285914933 | 107.93809989877 | 105.94285177473 |
| Phillips | 105.66173400647 | 105.59621204194 | 72.020552925529 | 118.77648488107 | 91.396217679998 | 178.04285914933 | 183.90068737474 | 122.19924972273 |
| Sedgwick | 25.009878613574 | 81.894670921246 | 83.34005727305 | 118.77648488107 | 91.396217679998 | 178.04285914933 | 130.47327948843 | 101.2762068581 |
| Washington | 115.33003442337 | 102.61820194956 | 50.460822866299 | 118.77648488107 | 91.396217679998 | 178.04285914933 | 119.60424344742 | 110.88983777101 |
| Yuma | 125.09251905506 | 91.349252810343 | 84.79337738163 | 118.77648488107 | 91.396217679998 | 178.04285914933 | 150.24245897124 | 119.95616713267 |
| Pueblo | 97.878499451333 | 92.988095667886 | 153.73598413417 | 108.1820797049 | 41.52095100402 | 171.60022248351 | 107.59907006479 | 110.50070035866 |
| category | applies_to | indicator | sub-text | data_type | raw_data | raw_data_state_average | normalized_data | category_score | simplified_category_score |
|---|---|---|---|---|---|---|---|---|---|
| individual | county | High School Graduation Rate | percent | 0.88710221522546 | 0.91158384662974 | 0.49704740518652 | 70.966225487895 | low | |
| Credentials held | % of CC participants completing training with occupational certification, certification, or license | percent | 0.005911330049261 | 0.0060053600924168 | 0.31921182266009 | 70.966225487895 | low | ||
| Training Completion Rate | for Connecting Colorado (CC) participants | percent | 0.34615384615385 | 0.69235591265914 | 0.34615384615385 | 70.966225487895 | low | ||
| neighborhood | county | Bachelors Degree of higher | % of population | percent | 0.1757562127516 | 0.31919195744088 | 0.16094787202123 | 107.04209118599 | average |
| Cost of Living | indexed to national average | number | 107.2 | 111.7078125 | 0.83967935871744 | 107.04209118599 | average | ||
| Absenteeism | Chronically absent/student body | percent | 0.0567837017772 | 0.14699662849725 | 0.86234254114618 | 107.04209118599 | average | ||
| Crime | Criminal acts per 1,000 residents | number | 0.043955206825627 | 0.032152995153139 | 0.44087072446103 | 107.04209118599 | average | ||
| Unemployment rate | percent | 0.043518518518519 | 0.047095452067673 | 0.77778933292049 | 107.04209118599 | average | |||
| Labor force participation rate | percent | 0.63968410661402 | 0.61374589071264 | 0.67523885498744 | 107.04209118599 | average | |||
| industry | county | Target Industries - Diversity | relative to county diversity | number | 0.018942867980198 | 0.048480946595015 | 0.074369958538701 | 90.985141012377 | average |
| Target Industries - Employment Change, 1 Year | % change | percent | -0.073276128224465 | -0.054063603534816 | 0.63870315192789 | 90.985141012377 | average | ||
| Target Industries - Employment Change, 5 Years | % change | percent | -0.093563873198121 | -0.021846911546034 | 0.47063679995439 | 90.985141012377 | average | ||
| Related Industries - Diversity | relative to county diversity | number | 0 | 0.071509052995474 | 0 | 90.985141012377 | average | ||
| Related Industries - Employment Change, 1 Year | % change | percent | 0.10037598316138 | -0.02361410833971 | 0.70601062852493 | 90.985141012377 | average | ||
| Related Industries - Employment Change, 5 Years | % change | percent | 0.0039366267332643 | -0.037060214673164 | 0.69018310933343 | 90.985141012377 | average | ||
| Target Industries - Employment | per 100,00 workers | number | 0.19197530864198 | 0.21299338245718 | 0.19619233948035 | 90.985141012377 | average | ||
| Target Industries - Income | average annual pay/MHI | number | 0.73179012345679 | 0.83593053070384 | 0.38602977050844 | 90.985141012377 | average | ||
| Related Industries - Employment | per 100,00 workers | number | 0.60123364028727 | 0.38864538870834 | 0.66268891806842 | 90.985141012377 | average | ||
| Related Industries - Income | average annual pay/MHI | number | 0.14940602042421 | 0.30736251703532 | 0.1121905534853 | 90.985141012377 | average | ||
| engagement | county | Decennial Census Participation | percent | 0.64 | 0.57375 | 0.72131147540984 | 117.00778411686 | average | |
| Management Diveristy | relative to regional diversity | number | 2.0958344552228 | 1.9021235388396 | 0.32075955836419 | 117.00778411686 | average | ||
| Sector Survey Partnerships | number | 0 | 0.40625 | 0 | 117.00778411686 | average | |||
| Completed Talent Gap Survey | number | 0.029185022026432 | 0.079886760824699 | 0.019676622296783 | 117.00778411686 | average | |||
| regional_context | region | Poverty | households living below the poverty line | percent | 0.090304082133026 | 0.083092833248716 | 0.57522332927336 | 99.729359059507 | average |
| Median Household Income | dollar | 57229 | 57007.9375 | 0.46918712706642 | 99.729359059507 | average | |||
| education_training | region | In-demand Occupations - Training Programs | programs per 100,000 residents | number | 0 | 4.4347320964544E-8 | 0 | 103.97729296803 | average |
| In-demand Occupations - Postsecondary Education Programs | programs per 100,000 residents | number | 1.9618922057946E-5 | 7.6006736827312E-6 | 0.1369727741679 | 103.97729296803 | average | ||
| Opportunity Occupations - Training Programs | programs per 100,000 residents | number | 0.00012163731675927 | 0.00014929954550687 | 0.2469819273902 | 103.97729296803 | average | ||
| Opportunity Occupations - Postsecondary Education Programs | programs per 100,000 residents | number | 0.00060818658379634 | 0.00038785139598413 | 0.35384633326706 | 103.97729296803 | average | ||
| regional_job_opportunities | region | In-demand Occupations - Program completers | per 100,00 workers | number | 0 | 0 | 104.64671724365 | average | |
| Opportunity Occupations - Program completers | per 100,00 workers | number | 0.0020835295225539 | 0.0050575085821559 | 0.07802960082822 | 104.64671724365 | average | ||
| In-demand Occupations - Job Openings | per 100,00 workers | number | 0.00030198182838435 | 0.00027291351906945 | 0.45219474699251 | 104.64671724365 | average | ||
| In-demand Occupations - Wages | median annual wages (bottom quartile)/MHI | number | 0.61853201857625 | 0.58812061720987 | 0.56600164877562 | 104.64671724365 | average | ||
| In-demand Occupations - Diversity | relative to regional diversity | number | 3.1675742100043 | 3.0176038430139 | 0.50094921234435 | 104.64671724365 | average | ||
| Opportunity Occupations - Job Openings | per 100,00 workers | number | 0.00031399342251871 | 0.00030772934015918 | 0.46395365067794 | 104.64671724365 | average | ||
| Opportunity Occupations - Wages | median annual wages (bottom quartile)/MHI | number | 0.54267032448584 | 0.5527573256027 | 0.43508842239832 | 104.64671724365 | average | ||
| Opportunity Occupations - Diversity | relative to regional diversity | number | 1.9686832815708 | 2.0802233709678 | 0.43151210427533 | 104.64671724365 | average | ||
| Automation Risk | local automation index risk for frontline occupations | number | 105.64062818134 | 105.894645296 | 0.70201282021977 | 104.64671724365 | average | ||
| not directly part of a score | Nonwhite county population | percent | 0.056296183438714 | 0.093467743953257 | 0.13254204290349 | ||||
| Population | number | 254856 | 573818.40625 | 0.074256352365536 | |||||
| Labor force | number | 133393 | 319974.734375 | 0.069266595539479 | |||||
| Nonwhite regional population | percent | 0.07484153512029 | 0.093467743953257 | 0.17815341585849 | |||||
| combined_score | county | 99.193515867759 | average |
| category | applies_to | indicator | sub-text | data_type | raw_data | raw_data_state_average | normalized_data | category_score | simplified_category_score |
|---|---|---|---|---|---|---|---|---|---|
| individual | county | High School Graduation Rate | percent | 0.96828478964401 | 0.91158384662974 | 0.90919372816661 | 102.24396553711 | average | |
| Credentials held | % of CC participants completing training with occupational certification, certification, or license | percent | 0.0033210332103321 | 0.0060053600924168 | 0.17933579335793 | 102.24396553711 | average | ||
| Training Completion Rate | for Connecting Colorado (CC) participants | percent | 0.58620689655172 | 0.69235591265914 | 0.58620689655172 | 102.24396553711 | average | ||
| neighborhood | county | Bachelors Degree of higher | % of population | percent | 0.49843581445523 | 0.31919195744088 | 0.76935068773765 | 112.58286459394 | average |
| Cost of Living | indexed to national average | number | 122.7 | 111.7078125 | 0.52905811623247 | 112.58286459394 | average | ||
| Absenteeism | Chronically absent/student body | percent | 0.16468885672938 | 0.14699662849725 | 0.60075428671666 | 112.58286459394 | average | ||
| Crime | Criminal acts per 1,000 residents | number | 0.035776962348436 | 0.032152995153139 | 0.35884293235482 | 112.58286459394 | average | ||
| Unemployment rate | percent | 0.030918196994992 | 0.047095452067673 | 0.8731920944552 | 112.58286459394 | average | |||
| Labor force participation rate | percent | 0.71055753262159 | 0.61374589071264 | 0.820135733424 | 112.58286459394 | average | |||
| industry | county | Target Industries - Diversity | relative to county diversity | number | 0.019168115443707 | 0.048480946595015 | 0.075254283158373 | 109.38718119506 | average |
| Target Industries - Employment Change, 1 Year | % change | percent | -0.015332008020491 | -0.054063603534816 | 0.6786385559216 | 109.38718119506 | average | ||
| Target Industries - Employment Change, 5 Years | % change | percent | -0.031035556120013 | -0.021846911546034 | 0.50310254815885 | 109.38718119506 | average | ||
| Related Industries - Diversity | relative to county diversity | number | 0.038223195941207 | 0.071509052995474 | 0.11417929538852 | 109.38718119506 | average | ||
| Related Industries - Employment Change, 1 Year | % change | percent | 0.041969731028269 | -0.02361410833971 | 0.66853667833945 | 109.38718119506 | average | ||
| Related Industries - Employment Change, 5 Years | % change | percent | 0.39142798099612 | -0.037060214673164 | 0.95657441392722 | 109.38718119506 | average | ||
| Target Industries - Employment | per 100,00 workers | number | 0.37849749582638 | 0.21299338245718 | 0.38681177136231 | 109.38718119506 | average | ||
| Target Industries - Income | average annual pay/MHI | number | 1.0812020033389 | 0.83593053070384 | 0.68392066858927 | 109.38718119506 | average | ||
| Related Industries - Employment | per 100,00 workers | number | 0.38364560601561 | 0.38864538870834 | 0.42286005728274 | 109.38718119506 | average | ||
| Related Industries - Income | average annual pay/MHI | number | 0.23469485536731 | 0.30736251703532 | 0.24339904819633 | 109.38718119506 | average | ||
| engagement | county | Decennial Census Participation | percent | 0.44 | 0.57375 | 0.39344262295082 | 91.459767303226 | average | |
| Management Diveristy | relative to regional diversity | number | 2.5492753576777 | 1.9021235388396 | 0.42109783674391 | 91.459767303226 | average | ||
| Sector Survey Partnerships | number | 0 | 0.40625 | 0 | 91.459767303226 | average | |||
| Completed Talent Gap Survey | number | 0.0071236559139785 | 0.079886760824699 | 0.0033468331781744 | 91.459767303226 | average | |||
| regional_context | region | Poverty | households living below the poverty line | percent | 0.090304082133026 | 0.083092833248716 | 0.57522332927336 | 99.729359059507 | average |
| Median Household Income | dollar | 57229 | 57007.9375 | 0.46918712706642 | 99.729359059507 | average | |||
| education_training | region | In-demand Occupations - Training Programs | programs per 100,000 residents | number | 0 | 4.4347320964544E-8 | 0 | 103.97729296803 | average |
| In-demand Occupations - Postsecondary Education Programs | programs per 100,000 residents | number | 1.9618922057946E-5 | 7.6006736827312E-6 | 0.1369727741679 | 103.97729296803 | average | ||
| Opportunity Occupations - Training Programs | programs per 100,000 residents | number | 0.00012163731675927 | 0.00014929954550687 | 0.2469819273902 | 103.97729296803 | average | ||
| Opportunity Occupations - Postsecondary Education Programs | programs per 100,000 residents | number | 0.00060818658379634 | 0.00038785139598413 | 0.35384633326706 | 103.97729296803 | average | ||
| regional_job_opportunities | region | In-demand Occupations - Program completers | per 100,00 workers | number | 0 | 0 | 104.64671724365 | average | |
| Opportunity Occupations - Program completers | per 100,00 workers | number | 0.0020835295225539 | 0.0050575085821559 | 0.07802960082822 | 104.64671724365 | average | ||
| In-demand Occupations - Job Openings | per 100,00 workers | number | 0.00030198182838435 | 0.00027291351906945 | 0.45219474699251 | 104.64671724365 | average | ||
| In-demand Occupations - Wages | median annual wages (bottom quartile)/MHI | number | 0.61853201857625 | 0.58812061720987 | 0.56600164877562 | 104.64671724365 | average | ||
| In-demand Occupations - Diversity | relative to regional diversity | number | 3.1675742100043 | 3.0176038430139 | 0.50094921234435 | 104.64671724365 | average | ||
| Opportunity Occupations - Job Openings | per 100,00 workers | number | 0.00031399342251871 | 0.00030772934015918 | 0.46395365067794 | 104.64671724365 | average | ||
| Opportunity Occupations - Wages | median annual wages (bottom quartile)/MHI | number | 0.54267032448584 | 0.5527573256027 | 0.43508842239832 | 104.64671724365 | average | ||
| Opportunity Occupations - Diversity | relative to regional diversity | number | 1.9686832815708 | 2.0802233709678 | 0.43151210427533 | 104.64671724365 | average | ||
| Automation Risk | local automation index risk for frontline occupations | number | 105.64062818134 | 105.894645296 | 0.70201282021977 | 104.64671724365 | average | ||
| not directly part of a score | Nonwhite county population | percent | 0.042677089980855 | 0.093467743953257 | 0.08079708398755 | ||||
| Population | number | 254856 | 573818.40625 | 0.074256352365536 | |||||
| Labor force | number | 133393 | 319974.734375 | 0.069266595539479 | |||||
| Nonwhite regional population | percent | 0.07484153512029 | 0.093467743953257 | 0.17815341585849 | |||||
| combined_score | county | 103.43244970008 | average |
| category | applies_to | indicator | sub-text | data_type | raw_data | raw_data_state_average | normalized_data | category_score | simplified_category_score |
|---|---|---|---|---|---|---|---|---|---|
| individual | county | High School Graduation Rate | percent | 0.87371663244353 | 0.91158384662974 | 0.42909170454474 | 133.03524944994 | high | |
| Credentials held | % of CC participants completing training with occupational certification, certification, or license | percent | 0.013888888888889 | 0.0060053600924168 | 0.75 | 133.03524944994 | high | ||
| Training Completion Rate | for Connecting Colorado (CC) participants | percent | 1 | 0.69235591265914 | 1 | 133.03524944994 | high | ||
| neighborhood | county | Bachelors Degree of higher | % of population | percent | 0.20020533880903 | 0.31919195744088 | 0.20704597384301 | 84.155376486734 | low |
| Cost of Living | indexed to national average | number | 119.5 | 111.7078125 | 0.59318637274549 | 84.155376486734 | low | ||
| Absenteeism | Chronically absent/student body | percent | 0.17391304347826 | 0.14699662849725 | 0.57839262187088 | 84.155376486734 | low | ||
| Crime | Criminal acts per 1,000 residents | number | 0.0023790642347343 | 0.032152995153139 | 0.023862014274385 | 84.155376486734 | low | ||
| Unemployment rate | percent | 0.016871165644172 | 0.047095452067673 | 0.97954855367178 | 84.155376486734 | low | |||
| Labor force participation rate | percent | 0.58897922312556 | 0.61374589071264 | 0.57157546868265 | 84.155376486734 | low | |||
| industry | county | Target Industries - Diversity | relative to county diversity | number | 0 | 0.048480946595015 | 0 | 72.976169302592 | average |
| Target Industries - Employment Change, 1 Year | % change | percent | -0.48658525465078 | -0.054063603534816 | 0.35384824551086 | 72.976169302592 | average | ||
| Target Industries - Employment Change, 5 Years | % change | percent | -0.18392386405996 | -0.021846911546034 | 0.42372038115148 | 72.976169302592 | average | ||
| Related Industries - Diversity | relative to county diversity | number | 0.013446542639172 | 0.071509052995474 | 0.040167147883552 | 72.976169302592 | average | ||
| Related Industries - Employment Change, 1 Year | % change | percent | 0.10076019654954 | -0.02361410833971 | 0.70625714311614 | 72.976169302592 | average | ||
| Related Industries - Employment Change, 5 Years | % change | percent | 0.15835097850812 | -0.037060214673164 | 0.7963393891182 | 72.976169302592 | average | ||
| Target Industries - Employment | per 100,00 workers | number | 0.10276073619632 | 0.21299338245718 | 0.10501803270272 | 72.976169302592 | average | ||
| Target Industries - Income | average annual pay/MHI | number | 0.89110429447853 | 0.83593053070384 | 0.52185297577176 | 72.976169302592 | average | ||
| Related Industries - Employment | per 100,00 workers | number | 0.16604752970607 | 0.38864538870834 | 0.18302012800926 | 72.976169302592 | average | ||
| Related Industries - Income | average annual pay/MHI | number | 0.094366791744841 | 0.30736251703532 | 0.027518106618201 | 72.976169302592 | average | ||
| engagement | county | Decennial Census Participation | percent | 0.39 | 0.57375 | 0.31147540983607 | 147.25755409678 | high | |
| Management Diveristy | relative to regional diversity | number | 5.1654047509543 | 1.9021235388396 | 1 | 147.25755409678 | high | ||
| Sector Survey Partnerships | number | 0 | 0.40625 | 0 | 147.25755409678 | high | |||
| Completed Talent Gap Survey | number | 0.14887640449438 | 0.079886760824699 | 0.10827199871425 | 147.25755409678 | high | |||
| regional_context | region | Poverty | households living below the poverty line | percent | 0.031834360086817 | 0.083092833248716 | 1 | 190.97732783913 | high |
| Median Household Income | dollar | 78935 | 57007.9375 | 1 | 190.97732783913 | high | |||
| education_training | region | In-demand Occupations - Training Programs | programs per 100,000 residents | number | 0 | 4.4347320964544E-8 | 0 | 0 | low |
| In-demand Occupations - Postsecondary Education Programs | programs per 100,000 residents | number | 0 | 7.6006736827312E-6 | 0 | 0 | low | ||
| Opportunity Occupations - Training Programs | programs per 100,000 residents | number | 0 | 0.00014929954550687 | 0 | 0 | low | ||
| Opportunity Occupations - Postsecondary Education Programs | programs per 100,000 residents | number | 0 | 0.00038785139598413 | 0 | 0 | low | ||
| regional_job_opportunities | region | In-demand Occupations - Program completers | per 100,00 workers | number | 0 | 0 | 99.069112450835 | average | |
| Opportunity Occupations - Program completers | per 100,00 workers | number | 0 | 0.0050575085821559 | 0 | 99.069112450835 | average | ||
| In-demand Occupations - Job Openings | per 100,00 workers | number | 0.00044596910791564 | 0.00027291351906945 | 1 | 99.069112450835 | average | ||
| In-demand Occupations - Wages | median annual wages (bottom quartile)/MHI | number | 0.50135793557991 | 0.58812061720987 | 0.16055080154748 | 99.069112450835 | average | ||
| In-demand Occupations - Diversity | relative to regional diversity | number | 3.6717291141108 | 3.0176038430139 | 0.70659257797633 | 99.069112450835 | average | ||
| Opportunity Occupations - Job Openings | per 100,00 workers | number | 0.00046720465651295 | 0.00030772934015918 | 1 | 99.069112450835 | average | ||
| Opportunity Occupations - Wages | median annual wages (bottom quartile)/MHI | number | 0.40695862543739 | 0.5527573256027 | 0 | 99.069112450835 | average | ||
| Opportunity Occupations - Diversity | relative to regional diversity | number | 2.1589142312022 | 2.0802233709678 | 0.56913583014528 | 99.069112450835 | average | ||
| Automation Risk | local automation index risk for frontline occupations | number | 108.60088288301 | 105.894645296 | 0 | 99.069112450835 | average | ||
| not directly part of a score | Nonwhite county population | percent | 0.021411578112609 | 0.093467743953257 | 0 | ||||
| Population | number | 119820 | 573818.40625 | 0.031388420553725 | |||||
| Labor force | number | 77223 | 319974.734375 | 0.037988823082629 | |||||
| Nonwhite regional population | percent | 0.072056675409729 | 0.093467743953257 | 0.15921835423235 | |||||
| combined_score | county | 103.924398518 | average |
| category | applies_to | indicator | sub-text | data_type | raw_data | raw_data_state_average | normalized_data | category_score | simplified_category_score |
|---|---|---|---|---|---|---|---|---|---|
| individual | county | High School Graduation Rate | percent | 0.95856905378174 | 0.91158384662974 | 0.85986904439844 | 113.78800302586 | average | |
| Credentials held | % of CC participants completing training with occupational certification, certification, or license | percent | 0.0047227674190382 | 0.0060053600924168 | 0.25502944062806 | 113.78800302586 | average | ||
| Training Completion Rate | for Connecting Colorado (CC) participants | percent | 0.74892703862661 | 0.69235591265914 | 0.74892703862661 | 113.78800302586 | average | ||
| neighborhood | county | Bachelors Degree of higher | % of population | percent | 0.47264172990515 | 0.31919195744088 | 0.72071670658036 | 120.37249596692 | high |
| Cost of Living | indexed to national average | number | 108.5 | 111.7078125 | 0.81362725450902 | 120.37249596692 | high | ||
| Absenteeism | Chronically absent/student body | percent | 0.096902401048922 | 0.14699662849725 | 0.76508508836625 | 120.37249596692 | high | ||
| Crime | Criminal acts per 1,000 residents | number | 0.042268247550655 | 0.032152995153139 | 0.42395052293307 | 120.37249596692 | high | ||
| Unemployment rate | percent | 0.046451794716571 | 0.047095452067673 | 0.75558016554998 | 120.37249596692 | high | |||
| Labor force participation rate | percent | 0.67418189238732 | 0.61374589071264 | 0.74576770836882 | 120.37249596692 | high | |||
| industry | county | Target Industries - Diversity | relative to county diversity | number | 0.12590585614722 | 0.048480946595015 | 0.49430811169863 | 135.58810805151 | high |
| Target Industries - Employment Change, 1 Year | % change | percent | 0.0026484231008966 | -0.054063603534816 | 0.69103076721562 | 135.58810805151 | high | ||
| Target Industries - Employment Change, 5 Years | % change | percent | 0.11959451342634 | -0.021846911546034 | 0.58131220001632 | 135.58810805151 | high | ||
| Related Industries - Diversity | relative to county diversity | number | 0.19534742580063 | 0.071509052995474 | 0.58353653807982 | 135.58810805151 | high | ||
| Related Industries - Employment Change, 1 Year | % change | percent | 0.010598835669605 | -0.02361410833971 | 0.64840884395513 | 135.58810805151 | high | ||
| Related Industries - Employment Change, 5 Years | % change | percent | 0.14138170574509 | -0.037060214673164 | 0.78467340829148 | 135.58810805151 | high | ||
| Target Industries - Employment | per 100,00 workers | number | 0.21824672003674 | 0.21299338245718 | 0.22304084254801 | 135.58810805151 | high | ||
| Target Industries - Income | average annual pay/MHI | number | 0.92187581542444 | 0.83593053070384 | 0.54808721833095 | 135.58810805151 | high | ||
| Related Industries - Employment | per 100,00 workers | number | 0.41438488613124 | 0.38864538870834 | 0.45674136218162 | 135.58810805151 | high | ||
| Related Industries - Income | average annual pay/MHI | number | 0.63281946066657 | 0.30736251703532 | 0.85587464601157 | 135.58810805151 | high | ||
| engagement | county | Decennial Census Participation | percent | 0.75 | 0.57375 | 0.90163934426229 | 127.2589842207 | average | |
| Management Diveristy | relative to regional diversity | number | 1.6934938485241 | 1.9021235388396 | 0.2317288520917 | 127.2589842207 | average | ||
| Sector Survey Partnerships | number | 1 | 0.40625 | 0.66666666666667 | 127.2589842207 | average | |||
| Completed Talent Gap Survey | number | 0.0048562700712775 | 0.079886760824699 | 0.0016685176798008 | 127.2589842207 | average | |||
| regional_context | region | Poverty | households living below the poverty line | percent | 0.059072782174443 | 0.083092833248716 | 0.80211559341629 | 158.25873178184 | average |
| Median Household Income | dollar | 73015.5 | 57007.9375 | 0.85524063386481 | 158.25873178184 | average | |||
| education_training | region | In-demand Occupations - Training Programs | programs per 100,000 residents | number | 0 | 4.4347320964544E-8 | 0 | 39.269220575047 | average |
| In-demand Occupations - Postsecondary Education Programs | programs per 100,000 residents | number | 4.6144546252986E-6 | 7.6006736827312E-6 | 0.032216584042293 | 39.269220575047 | average | ||
| Opportunity Occupations - Training Programs | programs per 100,000 residents | number | 1.9995970042961E-5 | 0.00014929954550687 | 0.040601382477231 | 39.269220575047 | average | ||
| Opportunity Occupations - Postsecondary Education Programs | programs per 100,000 residents | number | 0.00035377485460623 | 0.00038785139598413 | 0.20582817582576 | 39.269220575047 | average | ||
| regional_job_opportunities | region | In-demand Occupations - Program completers | per 100,00 workers | number | 0 | 0 | 102.86094501226 | average | |
| Opportunity Occupations - Program completers | per 100,00 workers | number | 0 | 0.0050575085821559 | 0 | 102.86094501226 | average | ||
| In-demand Occupations - Job Openings | per 100,00 workers | number | 0.00024724534407941 | 0.00027291351906945 | 0.24394764536649 | 102.86094501226 | average | ||
| In-demand Occupations - Wages | median annual wages (bottom quartile)/MHI | number | 0.48217212762085 | 0.58812061720987 | 0.094163236201645 | 102.86094501226 | average | ||
| In-demand Occupations - Diversity | relative to regional diversity | number | 4.0027176802802 | 3.0176038430139 | 0.84160188201833 | 102.86094501226 | average | ||
| Opportunity Occupations - Job Openings | per 100,00 workers | number | 0.0002848812557218 | 0.00030772934015918 | 0.36209773368346 | 102.86094501226 | average | ||
| Opportunity Occupations - Wages | median annual wages (bottom quartile)/MHI | number | 0.44905643322308 | 0.5527573256027 | 0.13496455283024 | 102.86094501226 | average | ||
| Opportunity Occupations - Diversity | relative to regional diversity | number | 2.6911873542129 | 2.0802233709678 | 0.95421202574399 | 102.86094501226 | average | ||
| Automation Risk | local automation index risk for frontline occupations | number | 104.65051447268 | 105.894645296 | 0.93681441231349 | 102.86094501226 | average | ||
| not directly part of a score | Nonwhite county population | percent | 0.086514533652758 | 0.093467743953257 | 0.24735491904475 | ||||
| Population | number | 650131 | 573818.40625 | 0.19973860707475 | |||||
| Labor force | number | 350803 | 319974.734375 | 0.1903294495513 | |||||
| Nonwhite regional population | percent | 0.091650068411471 | 0.093467743953257 | 0.29243946499286 | |||||
| combined_score | county | 113.91378409059 | average |
| category | applies_to | indicator | sub-text | data_type | raw_data | raw_data_state_average | normalized_data | category_score | simplified_category_score |
|---|---|---|---|---|---|---|---|---|---|
| individual | county | High School Graduation Rate | percent | 0.8809351785896 | 0.91158384662974 | 0.46573869772859 | 98.280364373482 | average | |
| Credentials held | % of CC participants completing training with occupational certification, certification, or license | percent | 0.0059067146445787 | 0.0060053600924168 | 0.31896259080725 | 98.280364373482 | average | ||
| Training Completion Rate | for Connecting Colorado (CC) participants | percent | 0.82511210762332 | 0.69235591265914 | 0.82511210762332 | 98.280364373482 | average | ||
| neighborhood | county | Bachelors Degree of higher | % of population | percent | 0.27529256131067 | 0.31919195744088 | 0.34862070417345 | 111.67771994841 | average |
| Cost of Living | indexed to national average | number | 103.8 | 111.7078125 | 0.90781563126252 | 111.67771994841 | average | ||
| Absenteeism | Chronically absent/student body | percent | 0.15960258864279 | 0.14699662849725 | 0.61308463359325 | 111.67771994841 | average | ||
| Crime | Criminal acts per 1,000 residents | number | 0.048536900882608 | 0.032152995153139 | 0.48682511585256 | 111.67771994841 | average | ||
| Unemployment rate | percent | 0.040487483117128 | 0.047095452067673 | 0.8007386796544 | 111.67771994841 | average | |||
| Labor force participation rate | percent | 0.68235692516085 | 0.61374589071264 | 0.76248111982258 | 111.67771994841 | average | |||
| industry | county | Target Industries - Diversity | relative to county diversity | number | 0.12966783225691 | 0.048480946595015 | 0.50907768131155 | 131.23190108589 | high |
| Target Industries - Employment Change, 1 Year | % change | percent | 0.013473507646318 | -0.054063603534816 | 0.69849147458447 | 131.23190108589 | high | ||
| Target Industries - Employment Change, 5 Years | % change | percent | 0.091684481985201 | -0.021846911546034 | 0.56682084481137 | 131.23190108589 | high | ||
| Related Industries - Diversity | relative to county diversity | number | 0.28538370460783 | 0.071509052995474 | 0.85249047090696 | 131.23190108589 | high | ||
| Related Industries - Employment Change, 1 Year | % change | percent | 0.053789753559813 | -0.02361410833971 | 0.67612050574425 | 131.23190108589 | high | ||
| Related Industries - Employment Change, 5 Years | % change | percent | 0.25510162507878 | -0.037060214673164 | 0.86285321110858 | 131.23190108589 | high | ||
| Target Industries - Employment | per 100,00 workers | number | 0.12930866601753 | 0.21299338245718 | 0.13214912834636 | 131.23190108589 | high | ||
| Target Industries - Income | average annual pay/MHI | number | 0.75473819769451 | 0.83593053070384 | 0.40559413805715 | 131.23190108589 | high | ||
| Related Industries - Employment | per 100,00 workers | number | 0.29949426837492 | 0.38864538870834 | 0.33010716529807 | 131.23190108589 | high | ||
| Related Industries - Income | average annual pay/MHI | number | 0.49562373567094 | 0.30736251703532 | 0.64481249972389 | 131.23190108589 | high | ||
| engagement | county | Decennial Census Participation | percent | 0.75 | 0.57375 | 0.90163934426229 | 141.58390077587 | high | |
| Management Diveristy | relative to regional diversity | number | 2.2700328849803 | 1.9021235388396 | 0.35930652323588 | 141.58390077587 | high | ||
| Sector Survey Partnerships | number | 1 | 0.40625 | 0.66666666666667 | 141.58390077587 | high | |||
| Completed Talent Gap Survey | number | 0.0078890444076855 | 0.079886760824699 | 0.0039133725589332 | 141.58390077587 | high | |||
| regional_context | region | Poverty | households living below the poverty line | percent | 0.059072782174443 | 0.083092833248716 | 0.80211559341629 | 158.25873178184 | average |
| Median Household Income | dollar | 73015.5 | 57007.9375 | 0.85524063386481 | 158.25873178184 | average | |||
| education_training | region | In-demand Occupations - Training Programs | programs per 100,000 residents | number | 0 | 4.4347320964544E-8 | 0 | 39.269220575047 | average |
| In-demand Occupations - Postsecondary Education Programs | programs per 100,000 residents | number | 4.6144546252986E-6 | 7.6006736827312E-6 | 0.032216584042293 | 39.269220575047 | average | ||
| Opportunity Occupations - Training Programs | programs per 100,000 residents | number | 1.9995970042961E-5 | 0.00014929954550687 | 0.040601382477231 | 39.269220575047 | average | ||
| Opportunity Occupations - Postsecondary Education Programs | programs per 100,000 residents | number | 0.00035377485460623 | 0.00038785139598413 | 0.20582817582576 | 39.269220575047 | average | ||
| regional_job_opportunities | region | In-demand Occupations - Program completers | per 100,00 workers | number | 0 | 0 | 102.86094501226 | average | |
| Opportunity Occupations - Program completers | per 100,00 workers | number | 0 | 0.0050575085821559 | 0 | 102.86094501226 | average | ||
| In-demand Occupations - Job Openings | per 100,00 workers | number | 0.00024724534407941 | 0.00027291351906945 | 0.24394764536649 | 102.86094501226 | average | ||
| In-demand Occupations - Wages | median annual wages (bottom quartile)/MHI | number | 0.48217212762085 | 0.58812061720987 | 0.094163236201645 | 102.86094501226 | average | ||
| In-demand Occupations - Diversity | relative to regional diversity | number | 4.0027176802802 | 3.0176038430139 | 0.84160188201833 | 102.86094501226 | average | ||
| Opportunity Occupations - Job Openings | per 100,00 workers | number | 0.0002848812557218 | 0.00030772934015918 | 0.36209773368346 | 102.86094501226 | average | ||
| Opportunity Occupations - Wages | median annual wages (bottom quartile)/MHI | number | 0.44905643322308 | 0.5527573256027 | 0.13496455283024 | 102.86094501226 | average | ||
| Opportunity Occupations - Diversity | relative to regional diversity | number | 2.6911873542129 | 2.0802233709678 | 0.95421202574399 | 102.86094501226 | average | ||
| Automation Risk | local automation index risk for frontline occupations | number | 104.65051447268 | 105.894645296 | 0.93681441231349 | 102.86094501226 | average | ||
| not directly part of a score | Nonwhite county population | percent | 0.096785603170185 | 0.093467743953257 | 0.28637925439031 | ||||
| Population | number | 650131 | 573818.40625 | 0.19973860707475 | |||||
| Labor force | number | 350803 | 319974.734375 | 0.1903294495513 | |||||
| Nonwhite regional population | percent | 0.091650068411471 | 0.093467743953257 | 0.29243946499286 | |||||
| combined_score | county | 111.8803976504 | average |
| category | applies_to | indicator | sub-text | data_type | raw_data | raw_data_state_average | normalized_data | category_score | simplified_category_score |
|---|---|---|---|---|---|---|---|---|---|
| individual | county | High School Graduation Rate | percent | 0.89594193335533 | 0.91158384662974 | 0.54192473692304 | 67.245169151591 | low | |
| Credentials held | % of CC participants completing training with occupational certification, certification, or license | percent | 0.0018741633199464 | 0.0060053600924168 | 0.10120481927711 | 67.245169151591 | low | ||
| Training Completion Rate | for Connecting Colorado (CC) participants | percent | 0.45833333333333 | 0.69235591265914 | 0.45833333333333 | 67.245169151591 | low | ||
| neighborhood | county | Bachelors Degree of higher | % of population | percent | 0.2021115143517 | 0.31919195744088 | 0.21064001127607 | 104.78465645358 | average |
| Cost of Living | indexed to national average | number | 110.4 | 111.7078125 | 0.77555110220441 | 104.78465645358 | average | ||
| Absenteeism | Chronically absent/student body | percent | 0.14650537634409 | 0.14699662849725 | 0.64483545128706 | 104.78465645358 | average | ||
| Crime | Criminal acts per 1,000 residents | number | 0.051519213583557 | 0.032152995153139 | 0.51673771224307 | 104.78465645358 | average | ||
| Unemployment rate | percent | 0.032781258045139 | 0.047095452067673 | 0.85908601241912 | 104.78465645358 | average | |||
| Labor force participation rate | percent | 0.63750752229334 | 0.61374589071264 | 0.67078894630536 | 104.78465645358 | average | |||
| industry | county | Target Industries - Diversity | relative to county diversity | number | 0.02368895826399 | 0.048480946595015 | 0.093003173846729 | 90.836267048335 | average |
| Target Industries - Employment Change, 1 Year | % change | percent | -0.18010395691505 | -0.054063603534816 | 0.56507682916191 | 90.836267048335 | average | ||
| Target Industries - Employment Change, 5 Years | % change | percent | -0.24655765688038 | -0.021846911546034 | 0.39119986817721 | 90.836267048335 | average | ||
| Related Industries - Diversity | relative to county diversity | number | 0.024059024723931 | 0.071509052995474 | 0.071868466858159 | 90.836267048335 | average | ||
| Related Industries - Employment Change, 1 Year | % change | percent | 0.019185157973463 | -0.02361410833971 | 0.65391790167652 | 90.836267048335 | average | ||
| Related Industries - Employment Change, 5 Years | % change | percent | 0.45459460418099 | -0.037060214673164 | 1 | 90.836267048335 | average | ||
| Target Industries - Employment | per 100,00 workers | number | 0.15970136445551 | 0.21299338245718 | 0.16320944882116 | 90.836267048335 | average | ||
| Target Industries - Income | average annual pay/MHI | number | 0.69295460396464 | 0.83593053070384 | 0.35292057060701 | 90.836267048335 | average | ||
| Related Industries - Employment | per 100,00 workers | number | 0.41760756217412 | 0.38864538870834 | 0.46029344502769 | 90.836267048335 | average | ||
| Related Industries - Income | average annual pay/MHI | number | 0.19288170348975 | 0.30736251703532 | 0.17907362130267 | 90.836267048335 | average | ||
| engagement | county | Decennial Census Participation | percent | 0.67 | 0.57375 | 0.77049180327869 | 109.38580765973 | average | |
| Management Diveristy | relative to regional diversity | number | 1.5668186842466 | 1.9021235388396 | 0.20369792716133 | 109.38580765973 | average | ||
| Sector Survey Partnerships | number | 1 | 0.40625 | 0.66666666666667 | 109.38580765973 | average | |||
| Completed Talent Gap Survey | number | 0.014197530864198 | 0.079886760824699 | 0.0085829044894281 | 109.38580765973 | average | |||
| regional_context | region | Poverty | households living below the poverty line | percent | 0.083329707625113 | 0.083092833248716 | 0.62589146108919 | 91.396217679998 | average |
| Median Household Income | dollar | 51588.5 | 57007.9375 | 0.33125061136653 | 91.396217679998 | average | |||
| education_training | region | In-demand Occupations - Training Programs | programs per 100,000 residents | number | 0 | 4.4347320964544E-8 | 0 | 178.04285914933 | average |
| In-demand Occupations - Postsecondary Education Programs | programs per 100,000 residents | number | 0 | 7.6006736827312E-6 | 0 | 178.04285914933 | average | ||
| Opportunity Occupations - Training Programs | programs per 100,000 residents | number | 0.00045592705167173 | 0.00014929954550687 | 0.92574996696181 | 178.04285914933 | average | ||
| Opportunity Occupations - Postsecondary Education Programs | programs per 100,000 residents | number | 0.00058027079303675 | 0.00038785139598413 | 0.33760477111541 | 178.04285914933 | average | ||
| regional_job_opportunities | region | In-demand Occupations - Program completers | per 100,00 workers | number | 0 | 0 | 118.77648488107 | average | |
| Opportunity Occupations - Program completers | per 100,00 workers | number | 0.0071843050566455 | 0.0050575085821559 | 0.2690571214518 | 118.77648488107 | average | ||
| In-demand Occupations - Job Openings | per 100,00 workers | number | 0.00027798597471882 | 0.00027291351906945 | 0.36090158046303 | 118.77648488107 | average | ||
| In-demand Occupations - Wages | median annual wages (bottom quartile)/MHI | number | 0.5623995637991 | 0.58812061720987 | 0.37176969266038 | 118.77648488107 | average | ||
| In-demand Occupations - Diversity | relative to regional diversity | number | 3.6647444484152 | 3.0176038430139 | 0.70374355250865 | 118.77648488107 | average | ||
| Opportunity Occupations - Job Openings | per 100,00 workers | number | 0.00029310114736792 | 0.00030772934015918 | 0.39085700148553 | 118.77648488107 | average | ||
| Opportunity Occupations - Wages | median annual wages (bottom quartile)/MHI | number | 0.54244879741318 | 0.5527573256027 | 0.43437821196521 | 118.77648488107 | average | ||
| Opportunity Occupations - Diversity | relative to regional diversity | number | 2.4632052762224 | 2.0802233709678 | 0.78927701876734 | 118.77648488107 | average | ||
| Automation Risk | local automation index risk for frontline occupations | number | 105.22803120036 | 105.894645296 | 0.79985857993278 | 118.77648488107 | average | ||
| not directly part of a score | Nonwhite county population | percent | 0.086148346738159 | 0.093467743953257 | 0.24596361301472 | ||||
| Population | number | 72380 | 573818.40625 | 0.016328327799553 | |||||
| Labor force | number | 36321 | 319974.734375 | 0.015212902679743 | |||||
| Nonwhite regional population | percent | 0.063897415198856 | 0.093467743953257 | 0.10374119883716 | |||||
| combined_score | county | 108.63820886052 | average |
| category | applies_to | indicator | sub-text | data_type | raw_data | raw_data_state_average | normalized_data | category_score | simplified_category_score |
|---|---|---|---|---|---|---|---|---|---|
| individual | county | High School Graduation Rate | percent | 0.86988847583643 | 0.91158384662974 | 0.40965698372307 | 25.009878613574 | low | |
| Credentials held | % of CC participants completing training with occupational certification, certification, or license | percent | 0 | 0.0060053600924168 | 0 | 25.009878613574 | low | ||
| Training Completion Rate | for Connecting Colorado (CC) participants | percent | 0 | 0.69235591265914 | 0 | 25.009878613574 | low | ||
| neighborhood | county | Bachelors Degree of higher | % of population | percent | 0.19516728624535 | 0.31919195744088 | 0.19754687520372 | 81.894670921246 | low |
| Cost of Living | indexed to national average | number | 116.9 | 111.7078125 | 0.64529058116232 | 81.894670921246 | low | ||
| Absenteeism | Chronically absent/student body | percent | 0.030952380952381 | 0.14699662849725 | 0.92496392496392 | 81.894670921246 | low | ||
| Crime | Criminal acts per 1,000 residents | number | 0.00086132644272179 | 0.032152995153139 | 0.0086391042204996 | 81.894670921246 | low | ||
| Unemployment rate | percent | 0.070088845014807 | 0.047095452067673 | 0.57661331388861 | 81.894670921246 | low | |||
| Labor force participation rate | percent | 0.56434540389972 | 0.61374589071264 | 0.52121296032283 | 81.894670921246 | low | |||
| industry | county | Target Industries - Diversity | relative to county diversity | number | 0 | 0.048480946595015 | 0 | 83.34005727305 | average |
| Target Industries - Employment Change, 1 Year | % change | percent | 0.18340400830699 | -0.054063603534816 | 0.81560850338476 | 83.34005727305 | average | ||
| Target Industries - Employment Change, 5 Years | % change | percent | -0.60022080706153 | -0.021846911546034 | 0.20757204450439 | 83.34005727305 | average | ||
| Related Industries - Diversity | relative to county diversity | number | 0 | 0.071509052995474 | 0 | 83.34005727305 | average | ||
| Related Industries - Employment Change, 1 Year | % change | percent | 0.55858274465414 | -0.02361410833971 | 1 | 83.34005727305 | average | ||
| Related Industries - Employment Change, 5 Years | % change | percent | 0.17819780008686 | -0.037060214673164 | 0.80998361790999 | 83.34005727305 | average | ||
| Target Industries - Employment | per 100,00 workers | number | 0.061204343534057 | 0.21299338245718 | 0.062548790410851 | 83.34005727305 | average | ||
| Target Industries - Income | average annual pay/MHI | number | 0.79861796643633 | 0.83593053070384 | 0.44300380976748 | 83.34005727305 | average | ||
| Related Industries - Employment | per 100,00 workers | number | 0.20060254924681 | 0.38864538870834 | 0.22110719928882 | 83.34005727305 | average | ||
| Related Industries - Income | average annual pay/MHI | number | 0.10662224797219 | 0.30736251703532 | 0.04637192218105 | 83.34005727305 | average | ||
| engagement | county | Decennial Census Participation | percent | 0.62 | 0.57375 | 0.68852459016393 | 130.47327948843 | average | |
| Management Diveristy | relative to regional diversity | number | 2.7859520484115 | 1.9021235388396 | 0.47347011183482 | 130.47327948843 | average | ||
| Sector Survey Partnerships | number | 0 | 0.40625 | 0 | 130.47327948843 | average | |||
| Completed Talent Gap Survey | number | 0.1010989010989 | 0.079886760824699 | 0.072907164502037 | 130.47327948843 | average | |||
| regional_context | region | Poverty | households living below the poverty line | percent | 0.083329707625113 | 0.083092833248716 | 0.62589146108919 | 91.396217679998 | average |
| Median Household Income | dollar | 51588.5 | 57007.9375 | 0.33125061136653 | 91.396217679998 | average | |||
| education_training | region | In-demand Occupations - Training Programs | programs per 100,000 residents | number | 0 | 4.4347320964544E-8 | 0 | 178.04285914933 | average |
| In-demand Occupations - Postsecondary Education Programs | programs per 100,000 residents | number | 0 | 7.6006736827312E-6 | 0 | 178.04285914933 | average | ||
| Opportunity Occupations - Training Programs | programs per 100,000 residents | number | 0.00045592705167173 | 0.00014929954550687 | 0.92574996696181 | 178.04285914933 | average | ||
| Opportunity Occupations - Postsecondary Education Programs | programs per 100,000 residents | number | 0.00058027079303675 | 0.00038785139598413 | 0.33760477111541 | 178.04285914933 | average | ||
| regional_job_opportunities | region | In-demand Occupations - Program completers | per 100,00 workers | number | 0 | 0 | 118.77648488107 | average | |
| Opportunity Occupations - Program completers | per 100,00 workers | number | 0.0071843050566455 | 0.0050575085821559 | 0.2690571214518 | 118.77648488107 | average | ||
| In-demand Occupations - Job Openings | per 100,00 workers | number | 0.00027798597471882 | 0.00027291351906945 | 0.36090158046303 | 118.77648488107 | average | ||
| In-demand Occupations - Wages | median annual wages (bottom quartile)/MHI | number | 0.5623995637991 | 0.58812061720987 | 0.37176969266038 | 118.77648488107 | average | ||
| In-demand Occupations - Diversity | relative to regional diversity | number | 3.6647444484152 | 3.0176038430139 | 0.70374355250865 | 118.77648488107 | average | ||
| Opportunity Occupations - Job Openings | per 100,00 workers | number | 0.00029310114736792 | 0.00030772934015918 | 0.39085700148553 | 118.77648488107 | average | ||
| Opportunity Occupations - Wages | median annual wages (bottom quartile)/MHI | number | 0.54244879741318 | 0.5527573256027 | 0.43437821196521 | 118.77648488107 | average | ||
| Opportunity Occupations - Diversity | relative to regional diversity | number | 2.4632052762224 | 2.0802233709678 | 0.78927701876734 | 118.77648488107 | average | ||
| Automation Risk | local automation index risk for frontline occupations | number | 105.22803120036 | 105.894645296 | 0.79985857993278 | 118.77648488107 | average | ||
| not directly part of a score | Nonwhite county population | percent | 0.063307493540052 | 0.093467743953257 | 0.15918111064051 | ||||
| Population | number | 72380 | 573818.40625 | 0.016328327799553 | |||||
| Labor force | number | 36321 | 319974.734375 | 0.015212902679743 | |||||
| Nonwhite regional population | percent | 0.063897415198856 | 0.093467743953257 | 0.10374119883716 | |||||
| combined_score | county | 101.2762068581 | average |
| category | applies_to | indicator | sub-text | data_type | raw_data | raw_data_state_average | normalized_data | category_score | simplified_category_score |
|---|---|---|---|---|---|---|---|---|---|
| individual | county | High School Graduation Rate | percent | 0.885 | 0.91158384662974 | 0.48637491442738 | 105.66173400647 | average | |
| Credentials held | % of CC participants completing training with occupational certification, certification, or license | percent | 0.004524886877828 | 0.0060053600924168 | 0.24434389140271 | 105.66173400647 | average | ||
| Training Completion Rate | for Connecting Colorado (CC) participants | percent | 1 | 0.69235591265914 | 1 | 105.66173400647 | average | ||
| neighborhood | county | Bachelors Degree of higher | % of population | percent | 0.23821428571429 | 0.31919195744088 | 0.27871071557903 | 105.59621204194 | average |
| Cost of Living | indexed to national average | number | 114.6 | 111.7078125 | 0.69138276553106 | 105.59621204194 | average | ||
| Absenteeism | Chronically absent/student body | percent | 0.0042826552462526 | 0.14699662849725 | 0.98961780546363 | 105.59621204194 | average | ||
| Crime | Criminal acts per 1,000 residents | number | 0.013286713286713 | 0.032152995153139 | 0.13326573426573 | 105.59621204194 | average | ||
| Unemployment rate | percent | 0.01417004048583 | 0.047095452067673 | 1 | 105.59621204194 | average | |||
| Labor force participation rate | percent | 0.60931236509405 | 0.61374589071264 | 0.61314547546807 | 105.59621204194 | average | |||
| industry | county | Target Industries - Diversity | relative to county diversity | number | 0.0051281543841981 | 0.048480946595015 | 0.020133204187008 | 72.020552925529 | low |
| Target Industries - Employment Change, 1 Year | % change | percent | -0.069059830335354 | -0.054063603534816 | 0.64160904745218 | 72.020552925529 | low | ||
| Target Industries - Employment Change, 5 Years | % change | percent | 0.24293977086941 | -0.021846911546034 | 0.64535512100775 | 72.020552925529 | low | ||
| Related Industries - Diversity | relative to county diversity | number | 0 | 0.071509052995474 | 0 | 72.020552925529 | low | ||
| Related Industries - Employment Change, 1 Year | % change | percent | -0.31605800503982 | -0.02361410833971 | 0.43882302515286 | 72.020552925529 | low | ||
| Related Industries - Employment Change, 5 Years | % change | percent | -0.068222999611721 | -0.037060214673164 | 0.64057504249641 | 72.020552925529 | low | ||
| Target Industries - Employment | per 100,00 workers | number | 0.064777327935223 | 0.21299338245718 | 0.066200260871038 | 72.020552925529 | low | ||
| Target Industries - Income | average annual pay/MHI | number | 0.85981781376518 | 0.83593053070384 | 0.49517970455776 | 72.020552925529 | low | ||
| Related Industries - Employment | per 100,00 workers | number | 0.15288828071547 | 0.38864538870834 | 0.16851580241629 | 72.020552925529 | low | ||
| Related Industries - Income | average annual pay/MHI | number | 0.076479327533965 | 0.30736251703532 | 0 | 72.020552925529 | low | ||
| engagement | county | Decennial Census Participation | percent | 0.71 | 0.57375 | 0.83606557377049 | 183.90068737474 | high | |
| Management Diveristy | relative to regional diversity | number | 4.2695046221332 | 1.9021235388396 | 0.80175348972844 | 183.90068737474 | high | ||
| Sector Survey Partnerships | number | 0 | 0.40625 | 0 | 183.90068737474 | high | |||
| Completed Talent Gap Survey | number | 0.053801169590643 | 0.079886760824699 | 0.037897456699653 | 183.90068737474 | high | |||
| regional_context | region | Poverty | households living below the poverty line | percent | 0.083329707625113 | 0.083092833248716 | 0.62589146108919 | 91.396217679998 | average |
| Median Household Income | dollar | 51588.5 | 57007.9375 | 0.33125061136653 | 91.396217679998 | average | |||
| education_training | region | In-demand Occupations - Training Programs | programs per 100,000 residents | number | 0 | 4.4347320964544E-8 | 0 | 178.04285914933 | average |
| In-demand Occupations - Postsecondary Education Programs | programs per 100,000 residents | number | 0 | 7.6006736827312E-6 | 0 | 178.04285914933 | average | ||
| Opportunity Occupations - Training Programs | programs per 100,000 residents | number | 0.00045592705167173 | 0.00014929954550687 | 0.92574996696181 | 178.04285914933 | average | ||
| Opportunity Occupations - Postsecondary Education Programs | programs per 100,000 residents | number | 0.00058027079303675 | 0.00038785139598413 | 0.33760477111541 | 178.04285914933 | average | ||
| regional_job_opportunities | region | In-demand Occupations - Program completers | per 100,00 workers | number | 0 | 0 | 118.77648488107 | average | |
| Opportunity Occupations - Program completers | per 100,00 workers | number | 0.0071843050566455 | 0.0050575085821559 | 0.2690571214518 | 118.77648488107 | average | ||
| In-demand Occupations - Job Openings | per 100,00 workers | number | 0.00027798597471882 | 0.00027291351906945 | 0.36090158046303 | 118.77648488107 | average | ||
| In-demand Occupations - Wages | median annual wages (bottom quartile)/MHI | number | 0.5623995637991 | 0.58812061720987 | 0.37176969266038 | 118.77648488107 | average | ||
| In-demand Occupations - Diversity | relative to regional diversity | number | 3.6647444484152 | 3.0176038430139 | 0.70374355250865 | 118.77648488107 | average | ||
| Opportunity Occupations - Job Openings | per 100,00 workers | number | 0.00029310114736792 | 0.00030772934015918 | 0.39085700148553 | 118.77648488107 | average | ||
| Opportunity Occupations - Wages | median annual wages (bottom quartile)/MHI | number | 0.54244879741318 | 0.5527573256027 | 0.43437821196521 | 118.77648488107 | average | ||
| Opportunity Occupations - Diversity | relative to regional diversity | number | 2.4632052762224 | 2.0802233709678 | 0.78927701876734 | 118.77648488107 | average | ||
| Automation Risk | local automation index risk for frontline occupations | number | 105.22803120036 | 105.894645296 | 0.79985857993278 | 118.77648488107 | average | ||
| not directly part of a score | Nonwhite county population | percent | 0.033566433566434 | 0.093467743953257 | 0.046181671198126 | ||||
| Population | number | 72380 | 573818.40625 | 0.016328327799553 | |||||
| Labor force | number | 36321 | 319974.734375 | 0.015212902679743 | |||||
| Nonwhite regional population | percent | 0.063897415198856 | 0.093467743953257 | 0.10374119883716 | |||||
| combined_score | county | 122.19924972273 | high |
| category | applies_to | indicator | sub-text | data_type | raw_data | raw_data_state_average | normalized_data | category_score | simplified_category_score |
|---|---|---|---|---|---|---|---|---|---|
| individual | county | High School Graduation Rate | percent | 0.78919623933482 | 0.91158384662974 | 0 | 46.640121114765 | low | |
| Credentials held | % of CC participants completing training with occupational certification, certification, or license | percent | 0.0023628248884221 | 0.0060053600924168 | 0.12759254397479 | 46.640121114765 | low | ||
| Training Completion Rate | for Connecting Colorado (CC) participants | percent | 0.63636363636364 | 0.69235591265914 | 0.63636363636364 | 46.640121114765 | low | ||
| neighborhood | county | Bachelors Degree of higher | % of population | percent | 0.17477311015706 | 0.31919195744088 | 0.15909426124601 | 97.902810698749 | average |
| Cost of Living | indexed to national average | number | 109.5 | 111.7078125 | 0.7935871743487 | 97.902810698749 | average | ||
| Absenteeism | Chronically absent/student body | percent | 0.14012041598248 | 0.14699662849725 | 0.66031414307276 | 97.902810698749 | average | ||
| Crime | Criminal acts per 1,000 residents | number | 0.032682259704738 | 0.032152995153139 | 0.32780306483852 | 97.902810698749 | average | ||
| Unemployment rate | percent | 0.040682967959528 | 0.047095452067673 | 0.79925857505799 | 97.902810698749 | average | |||
| Labor force participation rate | percent | 0.64986301369863 | 0.61374589071264 | 0.69604907886879 | 97.902810698749 | average | |||
| industry | county | Target Industries - Diversity | relative to county diversity | number | 0.049563197599283 | 0.048480946595015 | 0.19458579104058 | 100.90336900039 | average |
| Target Industries - Employment Change, 1 Year | % change | percent | -0.1081480555319 | -0.054063603534816 | 0.6146692292424 | 100.90336900039 | average | ||
| Target Industries - Employment Change, 5 Years | % change | percent | -0.066693755033902 | -0.021846911546034 | 0.48458821479023 | 100.90336900039 | average | ||
| Related Industries - Diversity | relative to county diversity | number | 0.092184044128655 | 0.071509052995474 | 0.27536967920904 | 100.90336900039 | average | ||
| Related Industries - Employment Change, 1 Year | % change | percent | -0.10689324712612 | -0.02361410833971 | 0.57302492019573 | 100.90336900039 | average | ||
| Related Industries - Employment Change, 5 Years | % change | percent | 0.098898708836246 | -0.037060214673164 | 0.75546733480081 | 100.90336900039 | average | ||
| Target Industries - Employment | per 100,00 workers | number | 0.14629005059022 | 0.21299338245718 | 0.14950353496511 | 100.90336900039 | average | ||
| Target Industries - Income | average annual pay/MHI | number | 0.90837549184935 | 0.83593053070384 | 0.53657752519882 | 100.90336900039 | average | ||
| Related Industries - Employment | per 100,00 workers | number | 0.33850576853818 | 0.38864538870834 | 0.37310623771036 | 100.90336900039 | average | ||
| Related Industries - Income | average annual pay/MHI | number | 0.34252361948468 | 0.30736251703532 | 0.40928300986411 | 100.90336900039 | average | ||
| engagement | county | Decennial Census Participation | percent | 0.67 | 0.57375 | 0.77049180327869 | 107.93809989877 | average | |
| Management Diveristy | relative to regional diversity | number | 1.5085523736291 | 1.9021235388396 | 0.19080464544978 | 107.93809989877 | average | ||
| Sector Survey Partnerships | number | 0 | 0.40625 | 0 | 107.93809989877 | average | |||
| Completed Talent Gap Survey | number | 0.011124546553809 | 0.079886760824699 | 0.0063082862496669 | 107.93809989877 | average | |||
| regional_context | region | Poverty | households living below the poverty line | percent | 0.083329707625113 | 0.083092833248716 | 0.62589146108919 | 91.396217679998 | average |
| Median Household Income | dollar | 51588.5 | 57007.9375 | 0.33125061136653 | 91.396217679998 | average | |||
| education_training | region | In-demand Occupations - Training Programs | programs per 100,000 residents | number | 0 | 4.4347320964544E-8 | 0 | 178.04285914933 | average |
| In-demand Occupations - Postsecondary Education Programs | programs per 100,000 residents | number | 0 | 7.6006736827312E-6 | 0 | 178.04285914933 | average | ||
| Opportunity Occupations - Training Programs | programs per 100,000 residents | number | 0.00045592705167173 | 0.00014929954550687 | 0.92574996696181 | 178.04285914933 | average | ||
| Opportunity Occupations - Postsecondary Education Programs | programs per 100,000 residents | number | 0.00058027079303675 | 0.00038785139598413 | 0.33760477111541 | 178.04285914933 | average | ||
| regional_job_opportunities | region | In-demand Occupations - Program completers | per 100,00 workers | number | 0 | 0 | 118.77648488107 | average | |
| Opportunity Occupations - Program completers | per 100,00 workers | number | 0.0071843050566455 | 0.0050575085821559 | 0.2690571214518 | 118.77648488107 | average | ||
| In-demand Occupations - Job Openings | per 100,00 workers | number | 0.00027798597471882 | 0.00027291351906945 | 0.36090158046303 | 118.77648488107 | average | ||
| In-demand Occupations - Wages | median annual wages (bottom quartile)/MHI | number | 0.5623995637991 | 0.58812061720987 | 0.37176969266038 | 118.77648488107 | average | ||
| In-demand Occupations - Diversity | relative to regional diversity | number | 3.6647444484152 | 3.0176038430139 | 0.70374355250865 | 118.77648488107 | average | ||
| Opportunity Occupations - Job Openings | per 100,00 workers | number | 0.00029310114736792 | 0.00030772934015918 | 0.39085700148553 | 118.77648488107 | average | ||
| Opportunity Occupations - Wages | median annual wages (bottom quartile)/MHI | number | 0.54244879741318 | 0.5527573256027 | 0.43437821196521 | 118.77648488107 | average | ||
| Opportunity Occupations - Diversity | relative to regional diversity | number | 2.4632052762224 | 2.0802233709678 | 0.78927701876734 | 118.77648488107 | average | ||
| Automation Risk | local automation index risk for frontline occupations | number | 105.22803120036 | 105.894645296 | 0.79985857993278 | 118.77648488107 | average | ||
| not directly part of a score | Nonwhite county population | percent | 0.11214363362205 | 0.093467743953257 | 0.34473120396909 | ||||
| Population | number | 72380 | 573818.40625 | 0.016328327799553 | |||||
| Labor force | number | 36321 | 319974.734375 | 0.015212902679743 | |||||
| Nonwhite regional population | percent | 0.063897415198856 | 0.093467743953257 | 0.10374119883716 | |||||
| combined_score | county | 105.94285177473 | average |
| category | applies_to | indicator | sub-text | data_type | raw_data | raw_data_state_average | normalized_data | category_score | simplified_category_score |
|---|---|---|---|---|---|---|---|---|---|
| individual | county | High School Graduation Rate | percent | 0.96937776642833 | 0.91158384662974 | 0.91474253424949 | 119.81949481153 | average | |
| Credentials held | % of CC participants completing training with occupational certification, certification, or license | percent | 0.0052439218178928 | 0.0060053600924168 | 0.28317177816621 | 119.81949481153 | average | ||
| Training Completion Rate | for Connecting Colorado (CC) participants | percent | 0.76470588235294 | 0.69235591265914 | 0.76470588235294 | 119.81949481153 | average | ||
| neighborhood | county | Bachelors Degree of higher | % of population | percent | 0.55749914879128 | 0.31919195744088 | 0.88071285233043 | 121.66488895206 | high |
| Cost of Living | indexed to national average | number | 120.3 | 111.7078125 | 0.57715430861723 | 121.66488895206 | high | ||
| Absenteeism | Chronically absent/student body | percent | 0.15183820647488 | 0.14699662849725 | 0.63190737824272 | 121.66488895206 | high | ||
| Crime | Criminal acts per 1,000 residents | number | 0.044353769554842 | 0.032152995153139 | 0.44486830863506 | 121.66488895206 | high | ||
| Unemployment rate | percent | 0.031801586302405 | 0.047095452067673 | 0.86650355247791 | 121.66488895206 | high | |||
| Labor force participation rate | percent | 0.73442932169539 | 0.61374589071264 | 0.86894031243673 | 121.66488895206 | high | |||
| industry | county | Target Industries - Diversity | relative to county diversity | number | 0.092755444304472 | 0.048480946595015 | 0.36415914181387 | 127.62334540178 | average |
| Target Industries - Employment Change, 1 Year | % change | percent | 0.065653725887533 | -0.054063603534816 | 0.7344543658771 | 127.62334540178 | average | ||
| Target Industries - Employment Change, 5 Years | % change | percent | 0.066918764897272 | -0.021846911546034 | 0.55396207021689 | 127.62334540178 | average | ||
| Related Industries - Diversity | relative to county diversity | number | 0.15385237121503 | 0.071509052995474 | 0.45958363518861 | 127.62334540178 | average | ||
| Related Industries - Employment Change, 1 Year | % change | percent | 0.062314580110112 | -0.02361410833971 | 0.68159010726495 | 127.62334540178 | average | ||
| Related Industries - Employment Change, 5 Years | % change | percent | 0.44912427627787 | -0.037060214673164 | 0.99623927664286 | 127.62334540178 | average | ||
| Target Industries - Employment | per 100,00 workers | number | 0.21203575475261 | 0.21299338245718 | 0.21669344392605 | 127.62334540178 | average | ||
| Target Industries - Income | average annual pay/MHI | number | 1.07488354526 | 0.83593053070384 | 0.67853387077275 | 127.62334540178 | average | ||
| Related Industries - Employment | per 100,00 workers | number | 0.27677978758712 | 0.38864538870834 | 0.30507091700937 | 127.62334540178 | average | ||
| Related Industries - Income | average annual pay/MHI | number | 0.42234800513564 | 0.30736251703532 | 0.53208498610735 | 127.62334540178 | average | ||
| engagement | county | Decennial Census Participation | percent | 0.8 | 0.57375 | 0.98360655737705 | 124.21634316507 | average | |
| Management Diveristy | relative to regional diversity | number | 1.2006159781946 | 1.9021235388396 | 0.12266388531747 | 124.21634316507 | average | ||
| Sector Survey Partnerships | number | 1.5 | 0.40625 | 1 | 124.21634316507 | average | |||
| Completed Talent Gap Survey | number | 0.083532219570406 | 0.079886760824699 | 0.059904333969609 | 124.21634316507 | average | |||
| regional_context | region | Poverty | households living below the poverty line | percent | 0.047454786961363 | 0.083092833248716 | 0.88651916426326 | 176.71787494652 | high |
| Median Household Income | dollar | 77469 | 57007.9375 | 0.96414946688839 | 176.71787494652 | high | |||
| education_training | region | In-demand Occupations - Training Programs | programs per 100,000 residents | number | 3.1535872685898E-7 | 4.4347320964544E-8 | 1 | 193.44445969274 | high |
| In-demand Occupations - Postsecondary Education Programs | programs per 100,000 residents | number | 6.9378919908975E-6 | 7.6006736827312E-6 | 0.048438049249783 | 193.44445969274 | high | ||
| Opportunity Occupations - Training Programs | programs per 100,000 residents | number | 6.3071745371795E-5 | 0.00014929954550687 | 0.12806580785253 | 193.44445969274 | high | ||
| Opportunity Occupations - Postsecondary Education Programs | programs per 100,000 residents | number | 0.00033711847901225 | 0.00038785139598413 | 0.19613740396976 | 193.44445969274 | high | ||
| regional_job_opportunities | region | In-demand Occupations - Program completers | per 100,00 workers | number | 0 | 0 | 66.151339958307 | low | |
| Opportunity Occupations - Program completers | per 100,00 workers | number | 0.003170931998567 | 0.0050575085821559 | 0.1187535647675 | 66.151339958307 | low | ||
| In-demand Occupations - Job Openings | per 100,00 workers | number | 0.00020973237709418 | 0.00027291351906945 | 0.10122809099128 | 66.151339958307 | low | ||
| In-demand Occupations - Wages | median annual wages (bottom quartile)/MHI | number | 0.4549592338032 | 0.58812061720987 | 0 | 66.151339958307 | low | ||
| In-demand Occupations - Diversity | relative to regional diversity | number | 2.5847822502142 | 3.0176038430139 | 0.26323001314928 | 66.151339958307 | low | ||
| Opportunity Occupations - Job Openings | per 100,00 workers | number | 0.00029180424952505 | 0.00030772934015918 | 0.38631949247925 | 66.151339958307 | low | ||
| Opportunity Occupations - Wages | median annual wages (bottom quartile)/MHI | number | 0.45354968003976 | 0.5527573256027 | 0.14936979337045 | 66.151339958307 | low | ||
| Opportunity Occupations - Diversity | relative to regional diversity | number | 1.875531883512 | 2.0802233709678 | 0.36412116449562 | 66.151339958307 | low | ||
| Automation Risk | local automation index risk for frontline occupations | number | 104.75733697161 | 105.894645296 | 0.91148187464576 | 66.151339958307 | low | ||
| not directly part of a score | Nonwhite county population | percent | 0.13709748696344 | 0.093467743953257 | 0.43954192833485 | ||||
| Population | number | 3170992 | 573818.40625 | 1 | |||||
| Labor force | number | 1804845 | 319974.734375 | 1 | |||||
| Nonwhite regional population | percent | 0.14380095465729 | 0.093467743953257 | 0.64702833034125 | |||||
| combined_score | county | 132.80539241829 | high |
| category | applies_to | indicator | sub-text | data_type | raw_data | raw_data_state_average | normalized_data | category_score | simplified_category_score |
|---|---|---|---|---|---|---|---|---|---|
| individual | county | High School Graduation Rate | percent | 0.95019623510611 | 0.91158384662974 | 0.81736205992724 | 107.49013418846 | average | |
| Credentials held | % of CC participants completing training with occupational certification, certification, or license | percent | 0.003566467695311 | 0.0060053600924168 | 0.19258925554679 | 107.49013418846 | average | ||
| Training Completion Rate | for Connecting Colorado (CC) participants | percent | 0.75071633237822 | 0.69235591265914 | 0.75071633237822 | 107.49013418846 | average | ||
| neighborhood | county | Bachelors Degree of higher | % of population | percent | 0.62076566943198 | 0.31919195744088 | 1 | 120.17538431992 | high |
| Cost of Living | indexed to national average | number | 117.3 | 111.7078125 | 0.63727454909819 | 120.17538431992 | high | ||
| Absenteeism | Chronically absent/student body | percent | 0.14903578911361 | 0.14699662849725 | 0.63870111730034 | 120.17538431992 | high | ||
| Crime | Criminal acts per 1,000 residents | number | 0.038167808750116 | 0.032152995153139 | 0.38282312176367 | 120.17538431992 | high | ||
| Unemployment rate | percent | 0.041977312210344 | 0.047095452067673 | 0.78945850641102 | 120.17538431992 | high | |||
| Labor force participation rate | percent | 0.68581555515717 | 0.61374589071264 | 0.76955210140711 | 120.17538431992 | high | |||
| industry | county | Target Industries - Diversity | relative to county diversity | number | 0.12463306172587 | 0.048480946595015 | 0.48931110340807 | 132.03032617831 | high |
| Target Industries - Employment Change, 1 Year | % change | percent | 0.020863510725207 | -0.054063603534816 | 0.70358470505257 | 132.03032617831 | high | ||
| Target Industries - Employment Change, 5 Years | % change | percent | 0.12277509222974 | -0.021846911546034 | 0.58296360973596 | 132.03032617831 | high | ||
| Related Industries - Diversity | relative to county diversity | number | 0.17440097606793 | 0.071509052995474 | 0.52096587091086 | 132.03032617831 | high | ||
| Related Industries - Employment Change, 1 Year | % change | percent | 0.0075180740936667 | -0.02361410833971 | 0.64643220101685 | 132.03032617831 | high | ||
| Related Industries - Employment Change, 5 Years | % change | percent | 0.13104013053901 | -0.037060214673164 | 0.7775638155731 | 132.03032617831 | high | ||
| Target Industries - Employment | per 100,00 workers | number | 0.21190700511374 | 0.21299338245718 | 0.21656186610473 | 132.03032617831 | high | ||
| Target Industries - Income | average annual pay/MHI | number | 1.0860567575957 | 0.83593053070384 | 0.68805958655055 | 132.03032617831 | high | ||
| Related Industries - Employment | per 100,00 workers | number | 0.50110456642455 | 0.38864538870834 | 0.55232512073737 | 132.03032617831 | high | ||
| Related Industries - Income | average annual pay/MHI | number | 0.42443640268235 | 0.30736251703532 | 0.53529778059146 | 132.03032617831 | high | ||
| engagement | county | Decennial Census Participation | percent | 0.78 | 0.57375 | 0.95081967213115 | 125.74046197017 | average | |
| Management Diveristy | relative to regional diversity | number | 1.4101255543602 | 1.9021235388396 | 0.16902456884361 | 125.74046197017 | average | ||
| Sector Survey Partnerships | number | 1 | 0.40625 | 0.66666666666667 | 125.74046197017 | average | |||
| Completed Talent Gap Survey | number | 0.015289565651523 | 0.079886760824699 | 0.009391226952158 | 125.74046197017 | average | |||
| regional_context | region | Poverty | households living below the poverty line | percent | 0.047454786961363 | 0.083092833248716 | 0.88651916426326 | 176.71787494652 | high |
| Median Household Income | dollar | 77469 | 57007.9375 | 0.96414946688839 | 176.71787494652 | high | |||
| education_training | region | In-demand Occupations - Training Programs | programs per 100,000 residents | number | 3.1535872685898E-7 | 4.4347320964544E-8 | 1 | 193.44445969274 | high |
| In-demand Occupations - Postsecondary Education Programs | programs per 100,000 residents | number | 6.9378919908975E-6 | 7.6006736827312E-6 | 0.048438049249783 | 193.44445969274 | high | ||
| Opportunity Occupations - Training Programs | programs per 100,000 residents | number | 6.3071745371795E-5 | 0.00014929954550687 | 0.12806580785253 | 193.44445969274 | high | ||
| Opportunity Occupations - Postsecondary Education Programs | programs per 100,000 residents | number | 0.00033711847901225 | 0.00038785139598413 | 0.19613740396976 | 193.44445969274 | high | ||
| regional_job_opportunities | region | In-demand Occupations - Program completers | per 100,00 workers | number | 0 | 0 | 66.151339958307 | low | |
| Opportunity Occupations - Program completers | per 100,00 workers | number | 0.003170931998567 | 0.0050575085821559 | 0.1187535647675 | 66.151339958307 | low | ||
| In-demand Occupations - Job Openings | per 100,00 workers | number | 0.00020973237709418 | 0.00027291351906945 | 0.10122809099128 | 66.151339958307 | low | ||
| In-demand Occupations - Wages | median annual wages (bottom quartile)/MHI | number | 0.4549592338032 | 0.58812061720987 | 0 | 66.151339958307 | low | ||
| In-demand Occupations - Diversity | relative to regional diversity | number | 2.5847822502142 | 3.0176038430139 | 0.26323001314928 | 66.151339958307 | low | ||
| Opportunity Occupations - Job Openings | per 100,00 workers | number | 0.00029180424952505 | 0.00030772934015918 | 0.38631949247925 | 66.151339958307 | low | ||
| Opportunity Occupations - Wages | median annual wages (bottom quartile)/MHI | number | 0.45354968003976 | 0.5527573256027 | 0.14936979337045 | 66.151339958307 | low | ||
| Opportunity Occupations - Diversity | relative to regional diversity | number | 1.875531883512 | 2.0802233709678 | 0.36412116449562 | 66.151339958307 | low | ||
| Automation Risk | local automation index risk for frontline occupations | number | 104.75733697161 | 105.894645296 | 0.91148187464576 | 66.151339958307 | low | ||
| not directly part of a score | Nonwhite county population | percent | 0.11026014697219 | 0.093467743953257 | 0.33757500523842 | ||||
| Population | number | 3170992 | 573818.40625 | 1 | |||||
| Labor force | number | 1804845 | 319974.734375 | 1 | |||||
| Nonwhite regional population | percent | 0.14380095465729 | 0.093467743953257 | 0.64702833034125 | |||||
| combined_score | county | 131.67856875063 | high |
| category | applies_to | indicator | sub-text | data_type | raw_data | raw_data_state_average | normalized_data | category_score | simplified_category_score |
|---|---|---|---|---|---|---|---|---|---|
| individual | county | High School Graduation Rate | percent | 0.94568690095847 | 0.91158384662974 | 0.79446914846995 | 120.21418567603 | average | |
| Credentials held | % of CC participants completing training with occupational certification, certification, or license | percent | 0.0032336297493936 | 0.0060053600924168 | 0.17461600646725 | 120.21418567603 | average | ||
| Training Completion Rate | for Connecting Colorado (CC) participants | percent | 1 | 0.69235591265914 | 1 | 120.21418567603 | average | ||
| neighborhood | county | Bachelors Degree of higher | % of population | percent | 0.37958725498662 | 0.31919195744088 | 0.54526525487239 | 108.54847838546 | average |
| Cost of Living | indexed to national average | number | 112.5 | 111.7078125 | 0.73346693386773 | 108.54847838546 | average | ||
| Absenteeism | Chronically absent/student body | percent | 0.11325028312571 | 0.14699662849725 | 0.72545385908919 | 108.54847838546 | average | ||
| Crime | Criminal acts per 1,000 residents | number | 0.016467359341306 | 0.032152995153139 | 0.1651676141933 | 108.54847838546 | average | ||
| Unemployment rate | percent | 0.032994072251426 | 0.047095452067673 | 0.85747469933194 | 108.54847838546 | average | |||
| Labor force participation rate | percent | 0.6923493882608 | 0.61374589071264 | 0.78291016908175 | 108.54847838546 | average | |||
| industry | county | Target Industries - Diversity | relative to county diversity | number | 0.015555265149144 | 0.048480946595015 | 0.061070183533437 | 99.854253159918 | average |
| Target Industries - Employment Change, 1 Year | % change | percent | -0.029532475739771 | -0.054063603534816 | 0.66885151604123 | 99.854253159918 | average | ||
| Target Industries - Employment Change, 5 Years | % change | percent | 0.14700876417034 | -0.021846911546034 | 0.59554613758986 | 99.854253159918 | average | ||
| Related Industries - Diversity | relative to county diversity | number | 0.026838412031586 | 0.071509052995474 | 0.080170977325572 | 99.854253159918 | average | ||
| Related Industries - Employment Change, 1 Year | % change | percent | -0.19431975602981 | -0.02361410833971 | 0.51693132541961 | 99.854253159918 | average | ||
| Related Industries - Employment Change, 5 Years | % change | percent | -0.090756276575874 | -0.037060214673164 | 0.62508393803377 | 99.854253159918 | average | ||
| Target Industries - Employment | per 100,00 workers | number | 0.43943630466391 | 0.21299338245718 | 0.4490891942015 | 99.854253159918 | average | ||
| Target Industries - Income | average annual pay/MHI | number | 0.87395145956828 | 0.83593053070384 | 0.50722933619267 | 99.854253159918 | average | ||
| Related Industries - Employment | per 100,00 workers | number | 0.39753644765302 | 0.38864538870834 | 0.43817075548546 | 99.854253159918 | average | ||
| Related Industries - Income | average annual pay/MHI | number | 0.32260226921594 | 0.30736251703532 | 0.37863596933276 | 99.854253159918 | average | ||
| engagement | county | Decennial Census Participation | percent | 0.33 | 0.57375 | 0.21311475409836 | 57.114210760613 | low | |
| Management Diveristy | relative to regional diversity | number | 1.9818834712242 | 1.9021235388396 | 0.29554426461325 | 57.114210760613 | low | ||
| Sector Survey Partnerships | number | 0 | 0.40625 | 0 | 57.114210760613 | low | |||
| Completed Talent Gap Survey | number | 0.015005662514156 | 0.079886760824699 | 0.0091810822884199 | 57.114210760613 | low | |||
| regional_context | region | Poverty | households living below the poverty line | percent | 0.031834360086817 | 0.083092833248716 | 1 | 190.97732783913 | high |
| Median Household Income | dollar | 78935 | 57007.9375 | 1 | 190.97732783913 | high | |||
| education_training | region | In-demand Occupations - Training Programs | programs per 100,000 residents | number | 0 | 4.4347320964544E-8 | 0 | 0 | low |
| In-demand Occupations - Postsecondary Education Programs | programs per 100,000 residents | number | 0 | 7.6006736827312E-6 | 0 | 0 | low | ||
| Opportunity Occupations - Training Programs | programs per 100,000 residents | number | 0 | 0.00014929954550687 | 0 | 0 | low | ||
| Opportunity Occupations - Postsecondary Education Programs | programs per 100,000 residents | number | 0 | 0.00038785139598413 | 0 | 0 | low | ||
| regional_job_opportunities | region | In-demand Occupations - Program completers | per 100,00 workers | number | 0 | 0 | 99.069112450835 | average | |
| Opportunity Occupations - Program completers | per 100,00 workers | number | 0 | 0.0050575085821559 | 0 | 99.069112450835 | average | ||
| In-demand Occupations - Job Openings | per 100,00 workers | number | 0.00044596910791564 | 0.00027291351906945 | 1 | 99.069112450835 | average | ||
| In-demand Occupations - Wages | median annual wages (bottom quartile)/MHI | number | 0.50135793557991 | 0.58812061720987 | 0.16055080154748 | 99.069112450835 | average | ||
| In-demand Occupations - Diversity | relative to regional diversity | number | 3.6717291141108 | 3.0176038430139 | 0.70659257797633 | 99.069112450835 | average | ||
| Opportunity Occupations - Job Openings | per 100,00 workers | number | 0.00046720465651295 | 0.00030772934015918 | 1 | 99.069112450835 | average | ||
| Opportunity Occupations - Wages | median annual wages (bottom quartile)/MHI | number | 0.40695862543739 | 0.5527573256027 | 0 | 99.069112450835 | average | ||
| Opportunity Occupations - Diversity | relative to regional diversity | number | 2.1589142312022 | 2.0802233709678 | 0.56913583014528 | 99.069112450835 | average | ||
| Automation Risk | local automation index risk for frontline occupations | number | 108.60088288301 | 105.894645296 | 0 | 99.069112450835 | average | ||
| not directly part of a score | Nonwhite county population | percent | 0.05181990459387 | 0.093467743953257 | 0.11553467999498 | ||||
| Population | number | 119820 | 573818.40625 | 0.031388420553725 | |||||
| Labor force | number | 77223 | 319974.734375 | 0.037988823082629 | |||||
| Nonwhite regional population | percent | 0.072056675409729 | 0.093467743953257 | 0.15921835423235 | |||||
| combined_score | county | 96.539652610284 | average |
| category | applies_to | indicator | sub-text | data_type | raw_data | raw_data_state_average | normalized_data | category_score | simplified_category_score |
|---|---|---|---|---|---|---|---|---|---|
| individual | county | High School Graduation Rate | percent | 0.91882269166864 | 0.91158384662974 | 0.6580853843695 | 80.905371798221 | average | |
| Credentials held | % of CC participants completing training with occupational certification, certification, or license | percent | 0.0097087378640776 | 0.0060053600924168 | 0.52427184466019 | 80.905371798221 | average | ||
| Training Completion Rate | for Connecting Colorado (CC) participants | percent | 0.14285714285714 | 0.69235591265914 | 0.14285714285714 | 80.905371798221 | average | ||
| neighborhood | county | Bachelors Degree of higher | % of population | percent | 0.22739140754807 | 0.31919195744088 | 0.25830449989102 | 84.670542726814 | low |
| Cost of Living | indexed to national average | number | 109.2 | 111.7078125 | 0.79959919839679 | 84.670542726814 | low | ||
| Absenteeism | Chronically absent/student body | percent | 0.18153117600631 | 0.14699662849725 | 0.55992442180287 | 84.670542726814 | low | ||
| Crime | Criminal acts per 1,000 residents | number | 0.010808270676692 | 0.032152995153139 | 0.10840695488722 | 84.670542726814 | low | ||
| Unemployment rate | percent | 0.059020791415158 | 0.047095452067673 | 0.66041457850311 | 84.670542726814 | low | |||
| Labor force participation rate | percent | 0.59556620730977 | 0.61374589071264 | 0.58504220086094 | 84.670542726814 | low | |||
| industry | county | Target Industries - Diversity | relative to county diversity | number | 0.004025157919566 | 0.048480946595015 | 0.015802824994757 | 84.900084227922 | average |
| Target Industries - Employment Change, 1 Year | % change | percent | -0.042893785070946 | -0.054063603534816 | 0.65964282870338 | 84.900084227922 | average | ||
| Target Industries - Employment Change, 5 Years | % change | percent | -0.033801694773664 | -0.021846911546034 | 0.50166632269774 | 84.900084227922 | average | ||
| Related Industries - Diversity | relative to county diversity | number | 0 | 0.071509052995474 | 0 | 84.900084227922 | average | ||
| Related Industries - Employment Change, 1 Year | % change | percent | 0.10771955106416 | -0.02361410833971 | 0.71072232440888 | 84.900084227922 | average | ||
| Related Industries - Employment Change, 5 Years | % change | percent | 0.19932650309813 | -0.037060214673164 | 0.8245091104084 | 84.900084227922 | average | ||
| Target Industries - Employment | per 100,00 workers | number | 0.064050972501677 | 0.21299338245718 | 0.065457949931107 | 84.900084227922 | average | ||
| Target Industries - Income | average annual pay/MHI | number | 0.96311200536553 | 0.83593053070384 | 0.58324310844873 | 84.900084227922 | average | ||
| Related Industries - Employment | per 100,00 workers | number | 0.10496348216421 | 0.38864538870834 | 0.1156923561344 | 84.900084227922 | average | ||
| Related Industries - Income | average annual pay/MHI | number | 0.20451010091719 | 0.30736251703532 | 0.1969627684973 | 84.900084227922 | average | ||
| engagement | county | Decennial Census Participation | percent | 0.56 | 0.57375 | 0.59016393442623 | 86.750201271304 | average | |
| Management Diveristy | relative to regional diversity | number | 1.470720529442 | 1.9021235388396 | 0.18243314192392 | 86.750201271304 | average | ||
| Sector Survey Partnerships | number | 0 | 0.40625 | 0 | 86.750201271304 | average | |||
| Completed Talent Gap Survey | number | 0.050572519083969 | 0.079886760824699 | 0.035507614581857 | 86.750201271304 | average | |||
| regional_context | region | Poverty | households living below the poverty line | percent | 0.090304082133026 | 0.083092833248716 | 0.57522332927336 | 99.729359059507 | average |
| Median Household Income | dollar | 57229 | 57007.9375 | 0.46918712706642 | 99.729359059507 | average | |||
| education_training | region | In-demand Occupations - Training Programs | programs per 100,000 residents | number | 0 | 4.4347320964544E-8 | 0 | 103.97729296803 | average |
| In-demand Occupations - Postsecondary Education Programs | programs per 100,000 residents | number | 1.9618922057946E-5 | 7.6006736827312E-6 | 0.1369727741679 | 103.97729296803 | average | ||
| Opportunity Occupations - Training Programs | programs per 100,000 residents | number | 0.00012163731675927 | 0.00014929954550687 | 0.2469819273902 | 103.97729296803 | average | ||
| Opportunity Occupations - Postsecondary Education Programs | programs per 100,000 residents | number | 0.00060818658379634 | 0.00038785139598413 | 0.35384633326706 | 103.97729296803 | average | ||
| regional_job_opportunities | region | In-demand Occupations - Program completers | per 100,00 workers | number | 0 | 0 | 104.64671724365 | average | |
| Opportunity Occupations - Program completers | per 100,00 workers | number | 0.0020835295225539 | 0.0050575085821559 | 0.07802960082822 | 104.64671724365 | average | ||
| In-demand Occupations - Job Openings | per 100,00 workers | number | 0.00030198182838435 | 0.00027291351906945 | 0.45219474699251 | 104.64671724365 | average | ||
| In-demand Occupations - Wages | median annual wages (bottom quartile)/MHI | number | 0.61853201857625 | 0.58812061720987 | 0.56600164877562 | 104.64671724365 | average | ||
| In-demand Occupations - Diversity | relative to regional diversity | number | 3.1675742100043 | 3.0176038430139 | 0.50094921234435 | 104.64671724365 | average | ||
| Opportunity Occupations - Job Openings | per 100,00 workers | number | 0.00031399342251871 | 0.00030772934015918 | 0.46395365067794 | 104.64671724365 | average | ||
| Opportunity Occupations - Wages | median annual wages (bottom quartile)/MHI | number | 0.54267032448584 | 0.5527573256027 | 0.43508842239832 | 104.64671724365 | average | ||
| Opportunity Occupations - Diversity | relative to regional diversity | number | 1.9686832815708 | 2.0802233709678 | 0.43151210427533 | 104.64671724365 | average | ||
| Automation Risk | local automation index risk for frontline occupations | number | 105.64062818134 | 105.894645296 | 0.70201282021977 | 104.64671724365 | average | ||
| not directly part of a score | Nonwhite county population | percent | 0.076127819548872 | 0.093467743953257 | 0.20789119877289 | ||||
| Population | number | 254856 | 573818.40625 | 0.074256352365536 | |||||
| Labor force | number | 133393 | 319974.734375 | 0.069266595539479 | |||||
| Nonwhite regional population | percent | 0.07484153512029 | 0.093467743953257 | 0.17815341585849 | |||||
| combined_score | county | 92.225652756493 | average |
| category | applies_to | indicator | sub-text | data_type | raw_data | raw_data_state_average | normalized_data | category_score | simplified_category_score |
|---|---|---|---|---|---|---|---|---|---|
| individual | county | High School Graduation Rate | percent | 0.88078273703496 | 0.91158384662974 | 0.4649647850181 | 63.931190872527 | low | |
| Credentials held | % of CC participants completing training with occupational certification, certification, or license | percent | 0.0026516924036811 | 0.0060053600924168 | 0.14319138979878 | 63.931190872527 | low | ||
| Training Completion Rate | for Connecting Colorado (CC) participants | percent | 0.4390243902439 | 0.69235591265914 | 0.4390243902439 | 63.931190872527 | low | ||
| neighborhood | county | Bachelors Degree of higher | % of population | percent | 0.30991399053387 | 0.31919195744088 | 0.41389838182121 | 98.505003001515 | average |
| Cost of Living | indexed to national average | number | 114.2 | 111.7078125 | 0.69939879759519 | 98.505003001515 | average | ||
| Absenteeism | Chronically absent/student body | percent | 0.27747384585853 | 0.14699662849725 | 0.32733613125205 | 98.505003001515 | average | ||
| Crime | Criminal acts per 1,000 residents | number | 0.03987807975616 | 0.032152995153139 | 0.39997713995428 | 98.505003001515 | average | ||
| Unemployment rate | percent | 0.044443772123559 | 0.047095452067673 | 0.7707838173171 | 98.505003001515 | average | |||
| Labor force participation rate | percent | 0.72313380589831 | 0.61374589071264 | 0.84584724255815 | 98.505003001515 | average | |||
| industry | county | Target Industries - Diversity | relative to county diversity | number | 0.039095902813528 | 0.048480946595015 | 0.15349104867936 | 115.60506243996 | average |
| Target Industries - Employment Change, 1 Year | % change | percent | 0.45094613824633 | -0.054063603534816 | 1 | 115.60506243996 | average | ||
| Target Industries - Employment Change, 5 Years | % change | percent | 0.098732614187228 | -0.021846911546034 | 0.57048035295224 | 115.60506243996 | average | ||
| Related Industries - Diversity | relative to county diversity | number | 0.14834050984331 | 0.071509052995474 | 0.44311875222407 | 115.60506243996 | average | ||
| Related Industries - Employment Change, 1 Year | % change | percent | -0.0089552527255679 | -0.02361410833971 | 0.63586277383967 | 115.60506243996 | average | ||
| Related Industries - Employment Change, 5 Years | % change | percent | 0.079918988381023 | -0.037060214673164 | 0.7424192178886 | 115.60506243996 | average | ||
| Target Industries - Employment | per 100,00 workers | number | 0.20993555804314 | 0.21299338245718 | 0.21454711318844 | 115.60506243996 | average | ||
| Target Industries - Income | average annual pay/MHI | number | 0.82936495930778 | 0.83593053070384 | 0.46921714093084 | 115.60506243996 | average | ||
| Related Industries - Employment | per 100,00 workers | number | 0.375969553709 | 0.38864538870834 | 0.4143993949757 | 115.60506243996 | average | ||
| Related Industries - Income | average annual pay/MHI | number | 0.30970487145304 | 0.30736251703532 | 0.35879458977484 | 115.60506243996 | average | ||
| engagement | county | Decennial Census Participation | percent | 0.64 | 0.57375 | 0.72131147540984 | 88.757493678323 | average | |
| Management Diveristy | relative to regional diversity | number | 0.9588368911313 | 1.9021235388396 | 0.069162542115276 | 88.757493678323 | average | ||
| Sector Survey Partnerships | number | 0 | 0.40625 | 0 | 88.757493678323 | average | |||
| Completed Talent Gap Survey | number | 0.0048820928518791 | 0.079886760824699 | 0.0016876316621141 | 88.757493678323 | average | |||
| regional_context | region | Poverty | households living below the poverty line | percent | 0.090304082133026 | 0.083092833248716 | 0.57522332927336 | 99.729359059507 | average |
| Median Household Income | dollar | 57229 | 57007.9375 | 0.46918712706642 | 99.729359059507 | average | |||
| education_training | region | In-demand Occupations - Training Programs | programs per 100,000 residents | number | 0 | 4.4347320964544E-8 | 0 | 103.97729296803 | average |
| In-demand Occupations - Postsecondary Education Programs | programs per 100,000 residents | number | 1.9618922057946E-5 | 7.6006736827312E-6 | 0.1369727741679 | 103.97729296803 | average | ||
| Opportunity Occupations - Training Programs | programs per 100,000 residents | number | 0.00012163731675927 | 0.00014929954550687 | 0.2469819273902 | 103.97729296803 | average | ||
| Opportunity Occupations - Postsecondary Education Programs | programs per 100,000 residents | number | 0.00060818658379634 | 0.00038785139598413 | 0.35384633326706 | 103.97729296803 | average | ||
| regional_job_opportunities | region | In-demand Occupations - Program completers | per 100,00 workers | number | 0 | 0 | 104.64671724365 | average | |
| Opportunity Occupations - Program completers | per 100,00 workers | number | 0.0020835295225539 | 0.0050575085821559 | 0.07802960082822 | 104.64671724365 | average | ||
| In-demand Occupations - Job Openings | per 100,00 workers | number | 0.00030198182838435 | 0.00027291351906945 | 0.45219474699251 | 104.64671724365 | average | ||
| In-demand Occupations - Wages | median annual wages (bottom quartile)/MHI | number | 0.61853201857625 | 0.58812061720987 | 0.56600164877562 | 104.64671724365 | average | ||
| In-demand Occupations - Diversity | relative to regional diversity | number | 3.1675742100043 | 3.0176038430139 | 0.50094921234435 | 104.64671724365 | average | ||
| Opportunity Occupations - Job Openings | per 100,00 workers | number | 0.00031399342251871 | 0.00030772934015918 | 0.46395365067794 | 104.64671724365 | average | ||
| Opportunity Occupations - Wages | median annual wages (bottom quartile)/MHI | number | 0.54267032448584 | 0.5527573256027 | 0.43508842239832 | 104.64671724365 | average | ||
| Opportunity Occupations - Diversity | relative to regional diversity | number | 1.9686832815708 | 2.0802233709678 | 0.43151210427533 | 104.64671724365 | average | ||
| Automation Risk | local automation index risk for frontline occupations | number | 105.64062818134 | 105.894645296 | 0.70201282021977 | 104.64671724365 | average | ||
| not directly part of a score | Nonwhite county population | percent | 0.13922614511896 | 0.093467743953257 | 0.44762964203945 | ||||
| Population | number | 254856 | 573818.40625 | 0.074256352365536 | |||||
| Labor force | number | 133393 | 319974.734375 | 0.069266595539479 | |||||
| Nonwhite regional population | percent | 0.07484153512029 | 0.093467743953257 | 0.17815341585849 | |||||
| combined_score | county | 96.450302751932 | average |
| category | applies_to | indicator | sub-text | data_type | raw_data | raw_data_state_average | normalized_data | category_score | simplified_category_score |
|---|---|---|---|---|---|---|---|---|---|
| individual | county | High School Graduation Rate | percent | 0.88256070640177 | 0.91158384662974 | 0.47399114987715 | 79.17285830495 | average | |
| Credentials held | % of CC participants completing training with occupational certification, certification, or license | percent | 0.0061210609839038 | 0.0060053600924168 | 0.33053729313081 | 79.17285830495 | average | ||
| Training Completion Rate | for Connecting Colorado (CC) participants | percent | 0.49230769230769 | 0.69235591265914 | 0.49230769230769 | 79.17285830495 | average | ||
| neighborhood | county | Bachelors Degree of higher | % of population | percent | 0.47165303207376 | 0.31919195744088 | 0.71885254615206 | 113.93440853433 | high |
| Cost of Living | indexed to national average | number | 121.7 | 111.7078125 | 0.54909819639279 | 113.93440853433 | high | ||
| Absenteeism | Chronically absent/student body | percent | 0.18721015377105 | 0.14699662849725 | 0.54615720297927 | 113.93440853433 | high | ||
| Crime | Criminal acts per 1,000 residents | number | 0.023225617673415 | 0.032152995153139 | 0.23295294526435 | 113.93440853433 | high | ||
| Unemployment rate | percent | 0.018558889335093 | 0.047095452067673 | 0.96677003047928 | 113.93440853433 | high | |||
| Labor force participation rate | percent | 0.79116739288308 | 0.61374589071264 | 0.98493822401969 | 113.93440853433 | high | |||
| industry | county | Target Industries - Diversity | relative to county diversity | number | 0.068154997902877 | 0.048480946595015 | 0.2675774530837 | 121.48855802124 | average |
| Target Industries - Employment Change, 1 Year | % change | percent | -0.0066634610465101 | -0.054063603534816 | 0.68461296582248 | 121.48855802124 | average | ||
| Target Industries - Employment Change, 5 Years | % change | percent | -0.0015050918422625 | -0.021846911546034 | 0.51843525919927 | 121.48855802124 | average | ||
| Related Industries - Diversity | relative to county diversity | number | 0.14764792971969 | 0.071509052995474 | 0.44104989564188 | 121.48855802124 | average | ||
| Related Industries - Employment Change, 1 Year | % change | percent | 0.0080029456533982 | -0.02361410833971 | 0.64674329875061 | 121.48855802124 | average | ||
| Related Industries - Employment Change, 5 Years | % change | percent | 0.18853278878379 | -0.037060214673164 | 0.81708868255633 | 121.48855802124 | average | ||
| Target Industries - Employment | per 100,00 workers | number | 0.43763983707188 | 0.21299338245718 | 0.44725326445526 | 121.48855802124 | average | ||
| Target Industries - Income | average annual pay/MHI | number | 1.0317250874878 | 0.83593053070384 | 0.64173915231649 | 121.48855802124 | average | ||
| Related Industries - Employment | per 100,00 workers | number | 0.39358414907418 | 0.38864538870834 | 0.43381447151598 | 121.48855802124 | average | ||
| Related Industries - Income | average annual pay/MHI | number | 0.30957828584907 | 0.30736251703532 | 0.35859985025753 | 121.48855802124 | average | ||
| engagement | county | Decennial Census Participation | percent | 0.42 | 0.57375 | 0.36065573770492 | 57.354509879574 | low | |
| Management Diveristy | relative to regional diversity | number | 1.3247991817206 | 1.9021235388396 | 0.15014338436136 | 57.354509879574 | low | ||
| Sector Survey Partnerships | number | 0 | 0.40625 | 0 | 57.354509879574 | low | |||
| Completed Talent Gap Survey | number | 0.0037187763120965 | 0.079886760824699 | 0.00082654655632293 | 57.354509879574 | low | |||
| regional_context | region | Poverty | households living below the poverty line | percent | 0.031834360086817 | 0.083092833248716 | 1 | 190.97732783913 | high |
| Median Household Income | dollar | 78935 | 57007.9375 | 1 | 190.97732783913 | high | |||
| education_training | region | In-demand Occupations - Training Programs | programs per 100,000 residents | number | 0 | 4.4347320964544E-8 | 0 | 0 | low |
| In-demand Occupations - Postsecondary Education Programs | programs per 100,000 residents | number | 0 | 7.6006736827312E-6 | 0 | 0 | low | ||
| Opportunity Occupations - Training Programs | programs per 100,000 residents | number | 0 | 0.00014929954550687 | 0 | 0 | low | ||
| Opportunity Occupations - Postsecondary Education Programs | programs per 100,000 residents | number | 0 | 0.00038785139598413 | 0 | 0 | low | ||
| regional_job_opportunities | region | In-demand Occupations - Program completers | per 100,00 workers | number | 0 | 0 | 99.069112450835 | average | |
| Opportunity Occupations - Program completers | per 100,00 workers | number | 0 | 0.0050575085821559 | 0 | 99.069112450835 | average | ||
| In-demand Occupations - Job Openings | per 100,00 workers | number | 0.00044596910791564 | 0.00027291351906945 | 1 | 99.069112450835 | average | ||
| In-demand Occupations - Wages | median annual wages (bottom quartile)/MHI | number | 0.50135793557991 | 0.58812061720987 | 0.16055080154748 | 99.069112450835 | average | ||
| In-demand Occupations - Diversity | relative to regional diversity | number | 3.6717291141108 | 3.0176038430139 | 0.70659257797633 | 99.069112450835 | average | ||
| Opportunity Occupations - Job Openings | per 100,00 workers | number | 0.00046720465651295 | 0.00030772934015918 | 1 | 99.069112450835 | average | ||
| Opportunity Occupations - Wages | median annual wages (bottom quartile)/MHI | number | 0.40695862543739 | 0.5527573256027 | 0 | 99.069112450835 | average | ||
| Opportunity Occupations - Diversity | relative to regional diversity | number | 2.1589142312022 | 2.0802233709678 | 0.56913583014528 | 99.069112450835 | average | ||
| Automation Risk | local automation index risk for frontline occupations | number | 108.60088288301 | 105.894645296 | 0 | 99.069112450835 | average | ||
| not directly part of a score | Nonwhite county population | percent | 0.1113732375048 | 0.093467743953257 | 0.34180412842185 | ||||
| Population | number | 119820 | 573818.40625 | 0.031388420553725 | |||||
| Labor force | number | 77223 | 319974.734375 | 0.037988823082629 | |||||
| Nonwhite regional population | percent | 0.072056675409729 | 0.093467743953257 | 0.15921835423235 | |||||
| combined_score | county | 94.570967861436 | average |
| category | applies_to | indicator | sub-text | data_type | raw_data | raw_data_state_average | normalized_data | category_score | simplified_category_score |
|---|---|---|---|---|---|---|---|---|---|
| individual | county | High School Graduation Rate | percent | 0.92880688385633 | 0.91158384662974 | 0.70877296267744 | 93.315615313573 | average | |
| Credentials held | % of CC participants completing training with occupational certification, certification, or license | percent | 0.0022975301550832 | 0.0060053600924168 | 0.12406662837449 | 93.315615313573 | average | ||
| Training Completion Rate | for Connecting Colorado (CC) participants | percent | 0.69565217391304 | 0.69235591265914 | 0.69565217391304 | 93.315615313573 | average | ||
| neighborhood | county | Bachelors Degree of higher | % of population | percent | 0.52365255361959 | 0.31919195744088 | 0.81689610129891 | 115.72985286538 | high |
| Cost of Living | indexed to national average | number | 120.1 | 111.7078125 | 0.5811623246493 | 115.72985286538 | high | ||
| Absenteeism | Chronically absent/student body | percent | 0.27676824154319 | 0.14699662849725 | 0.32904668716802 | 115.72985286538 | high | ||
| Crime | Criminal acts per 1,000 residents | number | 0.050572612483278 | 0.032152995153139 | 0.50724330320728 | 115.72985286538 | high | ||
| Unemployment rate | percent | 0.031682393780863 | 0.047095452067673 | 0.86740601323561 | 115.72985286538 | high | |||
| Labor force participation rate | percent | 0.77898385131018 | 0.61374589071264 | 0.96002963356962 | 115.72985286538 | high | |||
| industry | county | Target Industries - Diversity | relative to county diversity | number | 0.045329011329455 | 0.048480946595015 | 0.17796231788639 | 119.55384444148 | average |
| Target Industries - Employment Change, 1 Year | % change | percent | 0.044709623318376 | -0.054063603534816 | 0.72001957604095 | 119.55384444148 | average | ||
| Target Industries - Employment Change, 5 Years | % change | percent | -0.032114207144962 | -0.021846911546034 | 0.50254249450296 | 119.55384444148 | average | ||
| Related Industries - Diversity | relative to county diversity | number | 0.072086655160241 | 0.071509052995474 | 0.21533530335276 | 119.55384444148 | average | ||
| Related Industries - Employment Change, 1 Year | % change | percent | 0.040900517062885 | -0.02361410833971 | 0.66785066152767 | 119.55384444148 | average | ||
| Related Industries - Employment Change, 5 Years | % change | percent | 0.10605301739406 | -0.037060214673164 | 0.76038575573902 | 119.55384444148 | average | ||
| Target Industries - Employment | per 100,00 workers | number | 0.58680878110791 | 0.21299338245718 | 0.59969893215735 | 119.55384444148 | average | ||
| Target Industries - Income | average annual pay/MHI | number | 1.1063902605975 | 0.83593053070384 | 0.70539490288943 | 119.55384444148 | average | ||
| Related Industries - Employment | per 100,00 workers | number | 0.38551324259663 | 0.38864538870834 | 0.42491859489989 | 119.55384444148 | average | ||
| Related Industries - Income | average annual pay/MHI | number | 0.33589727880001 | 0.30736251703532 | 0.3990890356205 | 119.55384444148 | average | ||
| engagement | county | Decennial Census Participation | percent | 0.29 | 0.57375 | 0.14754098360656 | 32.566493143075 | low | |
| Management Diveristy | relative to regional diversity | number | 1.2902402768806 | 1.9021235388396 | 0.14249612317351 | 32.566493143075 | low | ||
| Sector Survey Partnerships | number | 0 | 0.40625 | 0 | 32.566493143075 | low | |||
| Completed Talent Gap Survey | number | 0.0055954391891892 | 0.079886760824699 | 0.0022156495190966 | 32.566493143075 | low | |||
| regional_context | region | Poverty | households living below the poverty line | percent | 0.031834360086817 | 0.083092833248716 | 1 | 190.97732783913 | high |
| Median Household Income | dollar | 78935 | 57007.9375 | 1 | 190.97732783913 | high | |||
| education_training | region | In-demand Occupations - Training Programs | programs per 100,000 residents | number | 0 | 4.4347320964544E-8 | 0 | 0 | low |
| In-demand Occupations - Postsecondary Education Programs | programs per 100,000 residents | number | 0 | 7.6006736827312E-6 | 0 | 0 | low | ||
| Opportunity Occupations - Training Programs | programs per 100,000 residents | number | 0 | 0.00014929954550687 | 0 | 0 | low | ||
| Opportunity Occupations - Postsecondary Education Programs | programs per 100,000 residents | number | 0 | 0.00038785139598413 | 0 | 0 | low | ||
| regional_job_opportunities | region | In-demand Occupations - Program completers | per 100,00 workers | number | 0 | 0 | 99.069112450835 | average | |
| Opportunity Occupations - Program completers | per 100,00 workers | number | 0 | 0.0050575085821559 | 0 | 99.069112450835 | average | ||
| In-demand Occupations - Job Openings | per 100,00 workers | number | 0.00044596910791564 | 0.00027291351906945 | 1 | 99.069112450835 | average | ||
| In-demand Occupations - Wages | median annual wages (bottom quartile)/MHI | number | 0.50135793557991 | 0.58812061720987 | 0.16055080154748 | 99.069112450835 | average | ||
| In-demand Occupations - Diversity | relative to regional diversity | number | 3.6717291141108 | 3.0176038430139 | 0.70659257797633 | 99.069112450835 | average | ||
| Opportunity Occupations - Job Openings | per 100,00 workers | number | 0.00046720465651295 | 0.00030772934015918 | 1 | 99.069112450835 | average | ||
| Opportunity Occupations - Wages | median annual wages (bottom quartile)/MHI | number | 0.40695862543739 | 0.5527573256027 | 0 | 99.069112450835 | average | ||
| Opportunity Occupations - Diversity | relative to regional diversity | number | 2.1589142312022 | 2.0802233709678 | 0.56913583014528 | 99.069112450835 | average | ||
| Automation Risk | local automation index risk for frontline occupations | number | 108.60088288301 | 105.894645296 | 0 | 99.069112450835 | average | ||
| not directly part of a score | Nonwhite county population | percent | 0.087148030930862 | 0.093467743953257 | 0.24976185536032 | ||||
| Population | number | 119820 | 573818.40625 | 0.031388420553725 | |||||
| Labor force | number | 77223 | 319974.734375 | 0.037988823082629 | |||||
| Nonwhite regional population | percent | 0.072056675409729 | 0.093467743953257 | 0.15921835423235 | |||||
| combined_score | county | 93.030320864781 | average |
| category | applies_to | indicator | sub-text | data_type | raw_data | raw_data_state_average | normalized_data | category_score | simplified_category_score |
|---|---|---|---|---|---|---|---|---|---|
| individual | county | High School Graduation Rate | percent | 0.98617136659436 | 0.91158384662974 | 1 | 135.63709731485 | high | |
| Credentials held | % of CC participants completing training with occupational certification, certification, or license | percent | 0.0064205457463884 | 0.0060053600924168 | 0.34670947030497 | 135.63709731485 | high | ||
| Training Completion Rate | for Connecting Colorado (CC) participants | percent | 0.875 | 0.69235591265914 | 0.875 | 135.63709731485 | high | ||
| neighborhood | county | Bachelors Degree of higher | % of population | percent | 0.48074837310195 | 0.31919195744088 | 0.7360015418191 | 106.69244242612 | average |
| Cost of Living | indexed to national average | number | 117.2 | 111.7078125 | 0.63927855711423 | 106.69244242612 | average | ||
| Absenteeism | Chronically absent/student body | percent | 0.21052631578947 | 0.14699662849725 | 0.4896331738437 | 106.69244242612 | average | ||
| Crime | Criminal acts per 1,000 residents | number | 0.029489204844655 | 0.032152995153139 | 0.29577672459189 | 106.69244242612 | average | ||
| Unemployment rate | percent | 0.031272994849154 | 0.047095452067673 | 0.87050575863349 | 106.69244242612 | average | |||
| Labor force participation rate | percent | 0.65835049049292 | 0.61374589071264 | 0.71340126518984 | 106.69244242612 | average | |||
| industry | county | Target Industries - Diversity | relative to county diversity | number | 0.010464187098802 | 0.048480946595015 | 0.041082541539782 | 83.773977834664 | average |
| Target Industries - Employment Change, 1 Year | % change | percent | -0.037094727200901 | -0.054063603534816 | 0.66363957104769 | 83.773977834664 | average | ||
| Target Industries - Employment Change, 5 Years | % change | percent | 0.45813344978869 | -0.021846911546034 | 0.75708727887564 | 83.773977834664 | average | ||
| Related Industries - Diversity | relative to county diversity | number | 0 | 0.071509052995474 | 0 | 83.773977834664 | average | ||
| Related Industries - Employment Change, 1 Year | % change | percent | 0.40443724934896 | -0.02361410833971 | 0.90109893373715 | 83.773977834664 | average | ||
| Related Industries - Employment Change, 5 Years | % change | percent | -0.70287942648274 | -0.037060214673164 | 0.20426349215324 | 83.773977834664 | average | ||
| Target Industries - Employment | per 100,00 workers | number | 0.2579102281089 | 0.21299338245718 | 0.26357562014895 | 83.773977834664 | average | ||
| Target Industries - Income | average annual pay/MHI | number | 0.60044150110375 | 0.83593053070384 | 0.27404857774639 | 83.773977834664 | average | ||
| Related Industries - Employment | per 100,00 workers | number | 0.39282731881897 | 0.38864538870834 | 0.43298028162809 | 83.773977834664 | average | ||
| Related Industries - Income | average annual pay/MHI | number | 0.13315873844319 | 0.30736251703532 | 0.087195706114033 | 83.773977834664 | average | ||
| engagement | county | Decennial Census Participation | percent | 0.55 | 0.57375 | 0.57377049180328 | 97.670429060392 | average | |
| Management Diveristy | relative to regional diversity | number | 1.9843140420773 | 1.9021235388396 | 0.29608210602447 | 97.670429060392 | average | ||
| Sector Survey Partnerships | number | 1 | 0.40625 | 0.66666666666667 | 97.670429060392 | average | |||
| Completed Talent Gap Survey | number | 0.64473684210526 | 0.079886760824699 | 0.47530712868635 | 97.670429060392 | average | |||
| regional_context | region | Poverty | households living below the poverty line | percent | 0.047454786961363 | 0.083092833248716 | 0.88651916426326 | 176.71787494652 | high |
| Median Household Income | dollar | 77469 | 57007.9375 | 0.96414946688839 | 176.71787494652 | high | |||
| education_training | region | In-demand Occupations - Training Programs | programs per 100,000 residents | number | 3.1535872685898E-7 | 4.4347320964544E-8 | 1 | 193.44445969274 | high |
| In-demand Occupations - Postsecondary Education Programs | programs per 100,000 residents | number | 6.9378919908975E-6 | 7.6006736827312E-6 | 0.048438049249783 | 193.44445969274 | high | ||
| Opportunity Occupations - Training Programs | programs per 100,000 residents | number | 6.3071745371795E-5 | 0.00014929954550687 | 0.12806580785253 | 193.44445969274 | high | ||
| Opportunity Occupations - Postsecondary Education Programs | programs per 100,000 residents | number | 0.00033711847901225 | 0.00038785139598413 | 0.19613740396976 | 193.44445969274 | high | ||
| regional_job_opportunities | region | In-demand Occupations - Program completers | per 100,00 workers | number | 0 | 0 | 66.151339958307 | low | |
| Opportunity Occupations - Program completers | per 100,00 workers | number | 0.003170931998567 | 0.0050575085821559 | 0.1187535647675 | 66.151339958307 | low | ||
| In-demand Occupations - Job Openings | per 100,00 workers | number | 0.00020973237709418 | 0.00027291351906945 | 0.10122809099128 | 66.151339958307 | low | ||
| In-demand Occupations - Wages | median annual wages (bottom quartile)/MHI | number | 0.4549592338032 | 0.58812061720987 | 0 | 66.151339958307 | low | ||
| In-demand Occupations - Diversity | relative to regional diversity | number | 2.5847822502142 | 3.0176038430139 | 0.26323001314928 | 66.151339958307 | low | ||
| Opportunity Occupations - Job Openings | per 100,00 workers | number | 0.00029180424952505 | 0.00030772934015918 | 0.38631949247925 | 66.151339958307 | low | ||
| Opportunity Occupations - Wages | median annual wages (bottom quartile)/MHI | number | 0.45354968003976 | 0.5527573256027 | 0.14936979337045 | 66.151339958307 | low | ||
| Opportunity Occupations - Diversity | relative to regional diversity | number | 1.875531883512 | 2.0802233709678 | 0.36412116449562 | 66.151339958307 | low | ||
| Automation Risk | local automation index risk for frontline occupations | number | 104.75733697161 | 105.894645296 | 0.91148187464576 | 66.151339958307 | low | ||
| not directly part of a score | Nonwhite county population | percent | 0.057714586624539 | 0.093467743953257 | 0.13793118387707 | ||||
| Population | number | 3170992 | 573818.40625 | 1 | |||||
| Labor force | number | 1804845 | 319974.734375 | 1 | |||||
| Nonwhite regional population | percent | 0.14380095465729 | 0.093467743953257 | 0.64702833034125 | |||||
| combined_score | county | 122.86966017623 | high |
| category | applies_to | indicator | sub-text | data_type | raw_data | raw_data_state_average | normalized_data | category_score | simplified_category_score |
|---|---|---|---|---|---|---|---|---|---|
| individual | county | High School Graduation Rate | percent | 0.98456225878529 | 0.91158384662974 | 0.99183090864591 | 122.40428598423 | average | |
| Credentials held | % of CC participants completing training with occupational certification, certification, or license | percent | 0.003610108303249 | 0.0060053600924168 | 0.19494584837545 | 122.40428598423 | average | ||
| Training Completion Rate | for Connecting Colorado (CC) participants | percent | 0.81818181818182 | 0.69235591265914 | 0.81818181818182 | 122.40428598423 | average | ||
| neighborhood | county | Bachelors Degree of higher | % of population | percent | 0.39569368271379 | 0.31919195744088 | 0.57563344650462 | 133.50616815328 | high |
| Cost of Living | indexed to national average | number | 113.9 | 111.7078125 | 0.70541082164329 | 133.50616815328 | high | ||
| Absenteeism | Chronically absent/student body | percent | 0.19135802469136 | 0.14699662849725 | 0.53610175832398 | 133.50616815328 | high | ||
| Crime | Criminal acts per 1,000 residents | number | 0.099700897308076 | 0.032152995153139 | 1 | 133.50616815328 | high | ||
| Unemployment rate | percent | 0.015353121801433 | 0.047095452067673 | 0.99104235360837 | 133.50616815328 | high | |||
| Labor force participation rate | percent | 0.73861273861274 | 0.61374589071264 | 0.87749308160098 | 133.50616815328 | high | |||
| industry | county | Target Industries - Diversity | relative to county diversity | number | 0.0087832649615283 | 0.048480946595015 | 0.034483218259564 | 103.87893387679 | average |
| Target Industries - Employment Change, 1 Year | % change | percent | -0.13736441265982 | -0.054063603534816 | 0.59453315640152 | 103.87893387679 | average | ||
| Target Industries - Employment Change, 5 Years | % change | percent | -0.35815615326757 | -0.021846911546034 | 0.33325606202652 | 103.87893387679 | average | ||
| Related Industries - Diversity | relative to county diversity | number | 0 | 0.071509052995474 | 0 | 103.87893387679 | average | ||
| Related Industries - Employment Change, 1 Year | % change | percent | -0.1946909695759 | -0.02361410833971 | 0.5166931516381 | 103.87893387679 | average | ||
| Related Industries - Employment Change, 5 Years | % change | percent | -0.037060214673164 | 0.68747676990253 | 103.87893387679 | average | |||
| Target Industries - Employment | per 100,00 workers | number | 0.97850562947799 | 0.21299338245718 | 1 | 103.87893387679 | average | ||
| Target Industries - Income | average annual pay/MHI | number | 1.1957523029683 | 0.83593053070384 | 0.78158046093387 | 103.87893387679 | average | ||
| Related Industries - Employment | per 100,00 workers | number | 0.38119910854082 | 0.38864538870834 | 0.42016349033109 | 103.87893387679 | average | ||
| Related Industries - Income | average annual pay/MHI | number | 0.15886639888001 | 0.30736251703532 | 0.1267444164547 | 103.87893387679 | average | ||
| engagement | county | Decennial Census Participation | percent | 0.5 | 0.57375 | 0.49180327868852 | 82.603616783773 | average | |
| Management Diveristy | relative to regional diversity | number | 1.748335535847 | 1.9021235388396 | 0.24386432654851 | 82.603616783773 | average | ||
| Sector Survey Partnerships | number | 1 | 0.40625 | 0.66666666666667 | 82.603616783773 | average | |||
| Completed Talent Gap Survey | number | 1.353591160221 | 0.079886760824699 | 1 | 82.603616783773 | average | |||
| regional_context | region | Poverty | households living below the poverty line | percent | 0.047454786961363 | 0.083092833248716 | 0.88651916426326 | 176.71787494652 | high |
| Median Household Income | dollar | 77469 | 57007.9375 | 0.96414946688839 | 176.71787494652 | high | |||
| education_training | region | In-demand Occupations - Training Programs | programs per 100,000 residents | number | 3.1535872685898E-7 | 4.4347320964544E-8 | 1 | 193.44445969274 | high |
| In-demand Occupations - Postsecondary Education Programs | programs per 100,000 residents | number | 6.9378919908975E-6 | 7.6006736827312E-6 | 0.048438049249783 | 193.44445969274 | high | ||
| Opportunity Occupations - Training Programs | programs per 100,000 residents | number | 6.3071745371795E-5 | 0.00014929954550687 | 0.12806580785253 | 193.44445969274 | high | ||
| Opportunity Occupations - Postsecondary Education Programs | programs per 100,000 residents | number | 0.00033711847901225 | 0.00038785139598413 | 0.19613740396976 | 193.44445969274 | high | ||
| regional_job_opportunities | region | In-demand Occupations - Program completers | per 100,00 workers | number | 0 | 0 | 66.151339958307 | low | |
| Opportunity Occupations - Program completers | per 100,00 workers | number | 0.003170931998567 | 0.0050575085821559 | 0.1187535647675 | 66.151339958307 | low | ||
| In-demand Occupations - Job Openings | per 100,00 workers | number | 0.00020973237709418 | 0.00027291351906945 | 0.10122809099128 | 66.151339958307 | low | ||
| In-demand Occupations - Wages | median annual wages (bottom quartile)/MHI | number | 0.4549592338032 | 0.58812061720987 | 0 | 66.151339958307 | low | ||
| In-demand Occupations - Diversity | relative to regional diversity | number | 2.5847822502142 | 3.0176038430139 | 0.26323001314928 | 66.151339958307 | low | ||
| Opportunity Occupations - Job Openings | per 100,00 workers | number | 0.00029180424952505 | 0.00030772934015918 | 0.38631949247925 | 66.151339958307 | low | ||
| Opportunity Occupations - Wages | median annual wages (bottom quartile)/MHI | number | 0.45354968003976 | 0.5527573256027 | 0.14936979337045 | 66.151339958307 | low | ||
| Opportunity Occupations - Diversity | relative to regional diversity | number | 1.875531883512 | 2.0802233709678 | 0.36412116449562 | 66.151339958307 | low | ||
| Automation Risk | local automation index risk for frontline occupations | number | 104.75733697161 | 105.894645296 | 0.91148187464576 | 66.151339958307 | low | ||
| not directly part of a score | Nonwhite county population | percent | 0.075772681954138 | 0.093467743953257 | 0.20654187399544 | ||||
| Population | number | 3170992 | 573818.40625 | 1 | |||||
| Labor force | number | 1804845 | 319974.734375 | 1 | |||||
| Nonwhite regional population | percent | 0.14380095465729 | 0.093467743953257 | 0.64702833034125 | |||||
| combined_score | county | 125.52952562795 | high |
| category | applies_to | indicator | sub-text | data_type | raw_data | raw_data_state_average | normalized_data | category_score | simplified_category_score |
|---|---|---|---|---|---|---|---|---|---|
| individual | county | High School Graduation Rate | percent | 0.94515759657687 | 0.91158384662974 | 0.79178198492316 | 118.61522509899 | average | |
| Credentials held | % of CC participants completing training with occupational certification, certification, or license | percent | 0.0058798133262062 | 0.0060053600924168 | 0.31750991961514 | 118.61522509899 | average | ||
| Training Completion Rate | for Connecting Colorado (CC) participants | percent | 0.83360258481422 | 0.69235591265914 | 0.83360258481422 | 118.61522509899 | average | ||
| neighborhood | county | Bachelors Degree of higher | % of population | percent | 0.45172542638462 | 0.31919195744088 | 0.68127963683971 | 108.15787462385 | average |
| Cost of Living | indexed to national average | number | 113.7 | 111.7078125 | 0.70941883767535 | 108.15787462385 | average | ||
| Absenteeism | Chronically absent/student body | percent | 0.18273905512752 | 0.14699662849725 | 0.5569962299939 | 108.15787462385 | average | ||
| Crime | Criminal acts per 1,000 residents | number | 0.022941102787413 | 0.032152995153139 | 0.23009926095775 | 108.15787462385 | average | ||
| Unemployment rate | percent | 0.036294386106992 | 0.047095452067673 | 0.83248652302513 | 108.15787462385 | average | |||
| Labor force participation rate | percent | 0.6937379344139 | 0.61374589071264 | 0.78574897643851 | 108.15787462385 | average | |||
| industry | county | Target Industries - Diversity | relative to county diversity | number | 0.20293058924211 | 0.048480946595015 | 0.7967082663484 | 135.86757263101 | high |
| Target Industries - Employment Change, 1 Year | % change | percent | 9.4635985549698E-5 | -0.054063603534816 | 0.68927068319318 | 135.86757263101 | high | ||
| Target Industries - Employment Change, 5 Years | % change | percent | 0.10135679129893 | -0.021846911546034 | 0.57184286960604 | 135.86757263101 | high | ||
| Related Industries - Diversity | relative to county diversity | number | 0.24269156203028 | 0.071509052995474 | 0.72496165919721 | 135.86757263101 | high | ||
| Related Industries - Employment Change, 1 Year | % change | percent | 0.0089697519626055 | -0.02361410833971 | 0.64736360993558 | 135.86757263101 | high | ||
| Related Industries - Employment Change, 5 Years | % change | percent | 0.21828617593663 | -0.037060214673164 | 0.83754344504983 | 135.86757263101 | high | ||
| Target Industries - Employment | per 100,00 workers | number | 0.17899364597066 | 0.21299338245718 | 0.1829255147629 | 135.86757263101 | high | ||
| Target Industries - Income | average annual pay/MHI | number | 0.79977652814862 | 0.83593053070384 | 0.44399154089178 | 135.86757263101 | high | ||
| Related Industries - Employment | per 100,00 workers | number | 0.286891764876 | 0.38864538870834 | 0.31621649310504 | 135.86757263101 | high | ||
| Related Industries - Income | average annual pay/MHI | number | 0.51087984720314 | 0.30736251703532 | 0.66828252872147 | 135.86757263101 | high | ||
| engagement | county | Decennial Census Participation | percent | 0.81 | 0.57375 | 1 | 142.69566594113 | high | |
| Management Diveristy | relative to regional diversity | number | 1.870274632495 | 1.9021235388396 | 0.27084724528963 | 142.69566594113 | high | ||
| Sector Survey Partnerships | number | 1 | 0.40625 | 0.66666666666667 | 142.69566594113 | high | |||
| Completed Talent Gap Survey | number | 0.011702330913259 | 0.079886760824699 | 0.0067359613400381 | 142.69566594113 | high | |||
| regional_context | region | Poverty | households living below the poverty line | percent | 0.047454786961363 | 0.083092833248716 | 0.88651916426326 | 176.71787494652 | high |
| Median Household Income | dollar | 77469 | 57007.9375 | 0.96414946688839 | 176.71787494652 | high | |||
| education_training | region | In-demand Occupations - Training Programs | programs per 100,000 residents | number | 3.1535872685898E-7 | 4.4347320964544E-8 | 1 | 193.44445969274 | high |
| In-demand Occupations - Postsecondary Education Programs | programs per 100,000 residents | number | 6.9378919908975E-6 | 7.6006736827312E-6 | 0.048438049249783 | 193.44445969274 | high | ||
| Opportunity Occupations - Training Programs | programs per 100,000 residents | number | 6.3071745371795E-5 | 0.00014929954550687 | 0.12806580785253 | 193.44445969274 | high | ||
| Opportunity Occupations - Postsecondary Education Programs | programs per 100,000 residents | number | 0.00033711847901225 | 0.00038785139598413 | 0.19613740396976 | 193.44445969274 | high | ||
| regional_job_opportunities | region | In-demand Occupations - Program completers | per 100,00 workers | number | 0 | 0 | 66.151339958307 | low | |
| Opportunity Occupations - Program completers | per 100,00 workers | number | 0.003170931998567 | 0.0050575085821559 | 0.1187535647675 | 66.151339958307 | low | ||
| In-demand Occupations - Job Openings | per 100,00 workers | number | 0.00020973237709418 | 0.00027291351906945 | 0.10122809099128 | 66.151339958307 | low | ||
| In-demand Occupations - Wages | median annual wages (bottom quartile)/MHI | number | 0.4549592338032 | 0.58812061720987 | 0 | 66.151339958307 | low | ||
| In-demand Occupations - Diversity | relative to regional diversity | number | 2.5847822502142 | 3.0176038430139 | 0.26323001314928 | 66.151339958307 | low | ||
| Opportunity Occupations - Job Openings | per 100,00 workers | number | 0.00029180424952505 | 0.00030772934015918 | 0.38631949247925 | 66.151339958307 | low | ||
| Opportunity Occupations - Wages | median annual wages (bottom quartile)/MHI | number | 0.45354968003976 | 0.5527573256027 | 0.14936979337045 | 66.151339958307 | low | ||
| Opportunity Occupations - Diversity | relative to regional diversity | number | 1.875531883512 | 2.0802233709678 | 0.36412116449562 | 66.151339958307 | low | ||
| Automation Risk | local automation index risk for frontline occupations | number | 104.75733697161 | 105.894645296 | 0.91148187464576 | 66.151339958307 | low | ||
| not directly part of a score | Nonwhite county population | percent | 0.09425746088191 | 0.093467743953257 | 0.27677372379863 | ||||
| Population | number | 3170992 | 573818.40625 | 1 | |||||
| Labor force | number | 1804845 | 319974.734375 | 1 | |||||
| Nonwhite regional population | percent | 0.14380095465729 | 0.093467743953257 | 0.64702833034125 | |||||
| combined_score | county | 134.52143041322 | high |
| category | applies_to | indicator | sub-text | data_type | raw_data | raw_data_state_average | normalized_data | category_score | simplified_category_score |
|---|---|---|---|---|---|---|---|---|---|
| individual | county | High School Graduation Rate | percent | 0.88021261288179 | 0.91158384662974 | 0.46207038834425 | 96.100695539668 | average | |
| Credentials held | % of CC participants completing training with occupational certification, certification, or license | percent | 0.0060247056273929 | 0.0060053600924168 | 0.32533410387922 | 96.100695539668 | average | ||
| Training Completion Rate | for Connecting Colorado (CC) participants | percent | 0.78670634920635 | 0.69235591265914 | 0.78670634920635 | 96.100695539668 | average | ||
| neighborhood | county | Bachelors Degree of higher | % of population | percent | 0.49437802476028 | 0.31919195744088 | 0.76169984565479 | 113.44611683129 | average |
| Cost of Living | indexed to national average | number | 125.6 | 111.7078125 | 0.47094188376753 | 113.44611683129 | average | ||
| Absenteeism | Chronically absent/student body | percent | 0.26912519125191 | 0.14699662849725 | 0.34757529393476 | 113.44611683129 | average | ||
| Crime | Criminal acts per 1,000 residents | number | 0.073035364014649 | 0.032152995153139 | 0.73254470106693 | 113.44611683129 | average | ||
| Unemployment rate | percent | 0.037464852043842 | 0.047095452067673 | 0.82362439340017 | 113.44611683129 | average | |||
| Labor force participation rate | percent | 0.72283942509108 | 0.61374589071264 | 0.84524539695195 | 113.44611683129 | average | |||
| industry | county | Target Industries - Diversity | relative to county diversity | number | 0.25471128870323 | 0.048480946595015 | 1 | 173.7331291566 | high |
| Target Industries - Employment Change, 1 Year | % change | percent | 0.029037054054103 | -0.054063603534816 | 0.70921795573876 | 173.7331291566 | high | ||
| Target Industries - Employment Change, 5 Years | % change | percent | 0.093598343360355 | -0.021846911546034 | 0.56781455365254 | 173.7331291566 | high | ||
| Related Industries - Diversity | relative to county diversity | number | 0.33476468576148 | 0.071509052995474 | 1 | 173.7331291566 | high | ||
| Related Industries - Employment Change, 1 Year | % change | percent | 0.011531839830634 | -0.02361410833971 | 0.64900746739314 | 173.7331291566 | high | ||
| Related Industries - Employment Change, 5 Years | % change | percent | 0.14451151783538 | -0.037060214673164 | 0.78682508139771 | 173.7331291566 | high | ||
| Target Industries - Employment | per 100,00 workers | number | 0.2333130893858 | 0.21299338245718 | 0.23843816770912 | 173.7331291566 | high | ||
| Target Industries - Income | average annual pay/MHI | number | 1.3542387956923 | 0.83593053070384 | 0.91669802953854 | 173.7331291566 | high | ||
| Related Industries - Employment | per 100,00 workers | number | 0.64469909027292 | 0.38864538870834 | 0.71059720212682 | 173.7331291566 | high | ||
| Related Industries - Income | average annual pay/MHI | number | 0.6868421973408 | 0.30736251703532 | 0.93898331977789 | 173.7331291566 | high | ||
| engagement | county | Decennial Census Participation | percent | 0.75 | 0.57375 | 0.90163934426229 | 106.46180408237 | average | |
| Management Diveristy | relative to regional diversity | number | 0.85646375820689 | 1.9021235388396 | 0.046509217604053 | 106.46180408237 | average | ||
| Sector Survey Partnerships | number | 1 | 0.40625 | 0.66666666666667 | 106.46180408237 | average | |||
| Completed Talent Gap Survey | number | 0.0070649979814291 | 0.079886760824699 | 0.0033034146671093 | 106.46180408237 | average | |||
| regional_context | region | Poverty | households living below the poverty line | percent | 0.047454786961363 | 0.083092833248716 | 0.88651916426326 | 176.71787494652 | high |
| Median Household Income | dollar | 77469 | 57007.9375 | 0.96414946688839 | 176.71787494652 | high | |||
| education_training | region | In-demand Occupations - Training Programs | programs per 100,000 residents | number | 3.1535872685898E-7 | 4.4347320964544E-8 | 1 | 193.44445969274 | high |
| In-demand Occupations - Postsecondary Education Programs | programs per 100,000 residents | number | 6.9378919908975E-6 | 7.6006736827312E-6 | 0.048438049249783 | 193.44445969274 | high | ||
| Opportunity Occupations - Training Programs | programs per 100,000 residents | number | 6.3071745371795E-5 | 0.00014929954550687 | 0.12806580785253 | 193.44445969274 | high | ||
| Opportunity Occupations - Postsecondary Education Programs | programs per 100,000 residents | number | 0.00033711847901225 | 0.00038785139598413 | 0.19613740396976 | 193.44445969274 | high | ||
| regional_job_opportunities | region | In-demand Occupations - Program completers | per 100,00 workers | number | 0 | 0 | 66.151339958307 | low | |
| Opportunity Occupations - Program completers | per 100,00 workers | number | 0.003170931998567 | 0.0050575085821559 | 0.1187535647675 | 66.151339958307 | low | ||
| In-demand Occupations - Job Openings | per 100,00 workers | number | 0.00020973237709418 | 0.00027291351906945 | 0.10122809099128 | 66.151339958307 | low | ||
| In-demand Occupations - Wages | median annual wages (bottom quartile)/MHI | number | 0.4549592338032 | 0.58812061720987 | 0 | 66.151339958307 | low | ||
| In-demand Occupations - Diversity | relative to regional diversity | number | 2.5847822502142 | 3.0176038430139 | 0.26323001314928 | 66.151339958307 | low | ||
| Opportunity Occupations - Job Openings | per 100,00 workers | number | 0.00029180424952505 | 0.00030772934015918 | 0.38631949247925 | 66.151339958307 | low | ||
| Opportunity Occupations - Wages | median annual wages (bottom quartile)/MHI | number | 0.45354968003976 | 0.5527573256027 | 0.14936979337045 | 66.151339958307 | low | ||
| Opportunity Occupations - Diversity | relative to regional diversity | number | 1.875531883512 | 2.0802233709678 | 0.36412116449562 | 66.151339958307 | low | ||
| Automation Risk | local automation index risk for frontline occupations | number | 104.75733697161 | 105.894645296 | 0.91148187464576 | 66.151339958307 | low | ||
| not directly part of a score | Nonwhite county population | percent | 0.23887858997472 | 0.093467743953257 | 0.82625335006306 | ||||
| Population | number | 3170992 | 573818.40625 | 1 | |||||
| Labor force | number | 1804845 | 319974.734375 | 1 | |||||
| Nonwhite regional population | percent | 0.14380095465729 | 0.093467743953257 | 0.64702833034125 | |||||
| combined_score | county | 132.29363145821 | high |
| category | applies_to | indicator | sub-text | data_type | raw_data | raw_data_state_average | normalized_data | category_score | simplified_category_score |
|---|---|---|---|---|---|---|---|---|---|
| individual | county | High School Graduation Rate | percent | 0.83781283249295 | 0.91158384662974 | 0.24681589921791 | 94.607275136452 | average | |
| Credentials held | % of CC participants completing training with occupational certification, certification, or license | percent | 0.0086944383512473 | 0.0060053600924168 | 0.46949967096735 | 94.607275136452 | average | ||
| Training Completion Rate | for Connecting Colorado (CC) participants | percent | 0.83333333333333 | 0.69235591265914 | 0.83333333333333 | 94.607275136452 | average | ||
| neighborhood | county | Bachelors Degree of higher | % of population | percent | 0.24267937271592 | 0.31919195744088 | 0.28712950464989 | 110.09717467633 | average |
| Cost of Living | indexed to national average | number | 104.4 | 111.7078125 | 0.89579158316633 | 110.09717467633 | average | ||
| Absenteeism | Chronically absent/student body | percent | 0.26941040847129 | 0.14699662849725 | 0.34688385825141 | 110.09717467633 | average | ||
| Crime | Criminal acts per 1,000 residents | number | 0.069955247684961 | 0.032152995153139 | 0.70165113428016 | 110.09717467633 | average | ||
| Unemployment rate | percent | 0.039943215287967 | 0.047095452067673 | 0.80485957877745 | 110.09717467633 | average | |||
| Labor force participation rate | percent | 0.7142954214613 | 0.61374589071264 | 0.82777764457922 | 110.09717467633 | average | |||
| industry | county | Target Industries - Diversity | relative to county diversity | number | 0.22894817314564 | 0.048480946595015 | 0.8988536562759 | 147.15330319205 | high |
| Target Industries - Employment Change, 1 Year | % change | percent | 0.11201219398363 | -0.054063603534816 | 0.76640487518555 | 147.15330319205 | high | ||
| Target Industries - Employment Change, 5 Years | % change | percent | 0.2176139706912 | -0.021846911546034 | 0.63220554190369 | 147.15330319205 | high | ||
| Related Industries - Diversity | relative to county diversity | number | 0.32291954171731 | 0.071509052995474 | 0.964616506615 | 147.15330319205 | high | ||
| Related Industries - Employment Change, 1 Year | % change | percent | 0.086585447731022 | -0.02361410833971 | 0.69716250321515 | 147.15330319205 | high | ||
| Related Industries - Employment Change, 5 Years | % change | percent | 0.20774970221904 | -0.037060214673164 | 0.83029986413229 | 147.15330319205 | high | ||
| Target Industries - Employment | per 100,00 workers | number | 0.15012458243845 | 0.21299338245718 | 0.15342229816147 | 147.15330319205 | high | ||
| Target Industries - Income | average annual pay/MHI | number | 0.87052939304021 | 0.83593053070384 | 0.50431185533403 | 147.15330319205 | high | ||
| Related Industries - Employment | per 100,00 workers | number | 0.23492036740541 | 0.38864538870834 | 0.25893282357545 | 147.15330319205 | high | ||
| Related Industries - Income | average annual pay/MHI | number | 0.506301989912 | 0.30736251703532 | 0.66123994495803 | 147.15330319205 | high | ||
| engagement | county | Decennial Census Participation | percent | 0.75 | 0.57375 | 0.90163934426229 | 117.29592286269 | average | |
| Management Diveristy | relative to regional diversity | number | 1.2925076526616 | 1.9021235388396 | 0.14299785246408 | 117.29592286269 | average | ||
| Sector Survey Partnerships | number | 1 | 0.40625 | 0.66666666666667 | 117.29592286269 | average | |||
| Completed Talent Gap Survey | number | 0.021066208082545 | 0.079886760824699 | 0.013667088756516 | 117.29592286269 | average | |||
| regional_context | region | Poverty | households living below the poverty line | percent | 0.047454786961363 | 0.083092833248716 | 0.88651916426326 | 176.71787494652 | high |
| Median Household Income | dollar | 77469 | 57007.9375 | 0.96414946688839 | 176.71787494652 | high | |||
| education_training | region | In-demand Occupations - Training Programs | programs per 100,000 residents | number | 3.1535872685898E-7 | 4.4347320964544E-8 | 1 | 193.44445969274 | high |
| In-demand Occupations - Postsecondary Education Programs | programs per 100,000 residents | number | 6.9378919908975E-6 | 7.6006736827312E-6 | 0.048438049249783 | 193.44445969274 | high | ||
| Opportunity Occupations - Training Programs | programs per 100,000 residents | number | 6.3071745371795E-5 | 0.00014929954550687 | 0.12806580785253 | 193.44445969274 | high | ||
| Opportunity Occupations - Postsecondary Education Programs | programs per 100,000 residents | number | 0.00033711847901225 | 0.00038785139598413 | 0.19613740396976 | 193.44445969274 | high | ||
| regional_job_opportunities | region | In-demand Occupations - Program completers | per 100,00 workers | number | 0 | 0 | 66.151339958307 | low | |
| Opportunity Occupations - Program completers | per 100,00 workers | number | 0.003170931998567 | 0.0050575085821559 | 0.1187535647675 | 66.151339958307 | low | ||
| In-demand Occupations - Job Openings | per 100,00 workers | number | 0.00020973237709418 | 0.00027291351906945 | 0.10122809099128 | 66.151339958307 | low | ||
| In-demand Occupations - Wages | median annual wages (bottom quartile)/MHI | number | 0.4549592338032 | 0.58812061720987 | 0 | 66.151339958307 | low | ||
| In-demand Occupations - Diversity | relative to regional diversity | number | 2.5847822502142 | 3.0176038430139 | 0.26323001314928 | 66.151339958307 | low | ||
| Opportunity Occupations - Job Openings | per 100,00 workers | number | 0.00029180424952505 | 0.00030772934015918 | 0.38631949247925 | 66.151339958307 | low | ||
| Opportunity Occupations - Wages | median annual wages (bottom quartile)/MHI | number | 0.45354968003976 | 0.5527573256027 | 0.14936979337045 | 66.151339958307 | low | ||
| Opportunity Occupations - Diversity | relative to regional diversity | number | 1.875531883512 | 2.0802233709678 | 0.36412116449562 | 66.151339958307 | low | ||
| Automation Risk | local automation index risk for frontline occupations | number | 104.75733697161 | 105.894645296 | 0.91148187464576 | 66.151339958307 | low | ||
| not directly part of a score | Nonwhite county population | percent | 0.18439501059297 | 0.093467743953257 | 0.61924613732709 | ||||
| Population | number | 3170992 | 573818.40625 | 1 | |||||
| Labor force | number | 1804845 | 319974.734375 | 1 | |||||
| Nonwhite regional population | percent | 0.14380095465729 | 0.093467743953257 | 0.64702833034125 | |||||
| combined_score | county | 129.35247863787 | high |
| category | applies_to | indicator | sub-text | data_type | raw_data | raw_data_state_average | normalized_data | category_score | simplified_category_score |
|---|---|---|---|---|---|---|---|---|---|
| individual | county | High School Graduation Rate | percent | 0.92614761342538 | 0.91158384662974 | 0.69527242345736 | 110.8399763001 | average | |
| Credentials held | % of CC participants completing training with occupational certification, certification, or license | percent | 0.0066986209877028 | 0.0060053600924168 | 0.36172553333595 | 110.8399763001 | average | ||
| Training Completion Rate | for Connecting Colorado (CC) participants | percent | 0.7585394581861 | 0.69235591265914 | 0.7585394581861 | 110.8399763001 | average | ||
| neighborhood | county | Bachelors Degree of higher | % of population | percent | 0.42751897178953 | 0.31919195744088 | 0.63563908486055 | 110.5533192391 | average |
| Cost of Living | indexed to national average | number | 111.6 | 111.7078125 | 0.75150300601202 | 110.5533192391 | average | ||
| Absenteeism | Chronically absent/student body | percent | 0.18741376529826 | 0.14699662849725 | 0.54566359927695 | 110.5533192391 | average | ||
| Crime | Criminal acts per 1,000 residents | number | 0.031492801290825 | 0.032152995153139 | 0.31587279694697 | 110.5533192391 | average | ||
| Unemployment rate | percent | 0.040584018617379 | 0.047095452067673 | 0.80000776550328 | 110.5533192391 | average | |||
| Labor force participation rate | percent | 0.71607525104668 | 0.61374589071264 | 0.83141640970741 | 110.5533192391 | average | |||
| industry | county | Target Industries - Diversity | relative to county diversity | number | 0.20807354295551 | 0.048480946595015 | 0.81689957290406 | 156.46348586145 | high |
| Target Industries - Employment Change, 1 Year | % change | percent | 0.0039453245906812 | -0.054063603534816 | 0.69192459880288 | 156.46348586145 | high | ||
| Target Industries - Employment Change, 5 Years | % change | percent | 0.074690340695019 | -0.021846911546034 | 0.55799720237447 | 156.46348586145 | high | ||
| Related Industries - Diversity | relative to county diversity | number | 0.30974152103103 | 0.071509052995474 | 0.92525148023446 | 156.46348586145 | high | ||
| Related Industries - Employment Change, 1 Year | % change | percent | 0.048243907942102 | -0.02361410833971 | 0.67256224383179 | 156.46348586145 | high | ||
| Related Industries - Employment Change, 5 Years | % change | percent | 0.21874205029929 | -0.037060214673164 | 0.83785684808415 | 156.46348586145 | high | ||
| Target Industries - Employment | per 100,00 workers | number | 0.1802473341924 | 0.21299338245718 | 0.18420674216106 | 156.46348586145 | high | ||
| Target Industries - Income | average annual pay/MHI | number | 1.0117704918934 | 0.83593053070384 | 0.6247268732707 | 156.46348586145 | high | ||
| Related Industries - Employment | per 100,00 workers | number | 0.41632874347896 | 0.38864538870834 | 0.4588839114941 | 156.46348586145 | high | ||
| Related Industries - Income | average annual pay/MHI | number | 0.72650458032675 | 0.30736251703532 | 1 | 156.46348586145 | high | ||
| engagement | county | Decennial Census Participation | percent | 0.77 | 0.57375 | 0.9344262295082 | 106.31610466892 | average | |
| Management Diveristy | relative to regional diversity | number | 0.70243182373151 | 1.9021235388396 | 0.012424733745004 | 106.31610466892 | average | ||
| Sector Survey Partnerships | number | 1 | 0.40625 | 0.66666666666667 | 106.31610466892 | average | |||
| Completed Talent Gap Survey | number | 0.010720693125629 | 0.079886760824699 | 0.0060093545659538 | 106.31610466892 | average | |||
| regional_context | region | Poverty | households living below the poverty line | percent | 0.047454786961363 | 0.083092833248716 | 0.88651916426326 | 176.71787494652 | high |
| Median Household Income | dollar | 77469 | 57007.9375 | 0.96414946688839 | 176.71787494652 | high | |||
| education_training | region | In-demand Occupations - Training Programs | programs per 100,000 residents | number | 3.1535872685898E-7 | 4.4347320964544E-8 | 1 | 193.44445969274 | high |
| In-demand Occupations - Postsecondary Education Programs | programs per 100,000 residents | number | 6.9378919908975E-6 | 7.6006736827312E-6 | 0.048438049249783 | 193.44445969274 | high | ||
| Opportunity Occupations - Training Programs | programs per 100,000 residents | number | 6.3071745371795E-5 | 0.00014929954550687 | 0.12806580785253 | 193.44445969274 | high | ||
| Opportunity Occupations - Postsecondary Education Programs | programs per 100,000 residents | number | 0.00033711847901225 | 0.00038785139598413 | 0.19613740396976 | 193.44445969274 | high | ||
| regional_job_opportunities | region | In-demand Occupations - Program completers | per 100,00 workers | number | 0 | 0 | 66.151339958307 | low | |
| Opportunity Occupations - Program completers | per 100,00 workers | number | 0.003170931998567 | 0.0050575085821559 | 0.1187535647675 | 66.151339958307 | low | ||
| In-demand Occupations - Job Openings | per 100,00 workers | number | 0.00020973237709418 | 0.00027291351906945 | 0.10122809099128 | 66.151339958307 | low | ||
| In-demand Occupations - Wages | median annual wages (bottom quartile)/MHI | number | 0.4549592338032 | 0.58812061720987 | 0 | 66.151339958307 | low | ||
| In-demand Occupations - Diversity | relative to regional diversity | number | 2.5847822502142 | 3.0176038430139 | 0.26323001314928 | 66.151339958307 | low | ||
| Opportunity Occupations - Job Openings | per 100,00 workers | number | 0.00029180424952505 | 0.00030772934015918 | 0.38631949247925 | 66.151339958307 | low | ||
| Opportunity Occupations - Wages | median annual wages (bottom quartile)/MHI | number | 0.45354968003976 | 0.5527573256027 | 0.14936979337045 | 66.151339958307 | low | ||
| Opportunity Occupations - Diversity | relative to regional diversity | number | 1.875531883512 | 2.0802233709678 | 0.36412116449562 | 66.151339958307 | low | ||
| Automation Risk | local automation index risk for frontline occupations | number | 104.75733697161 | 105.894645296 | 0.91148187464576 | 66.151339958307 | low | ||
| not directly part of a score | Nonwhite county population | percent | 0.28460810475363 | 0.093467743953257 | 1 | ||||
| Population | number | 3170992 | 573818.40625 | 1 | |||||
| Labor force | number | 1804845 | 319974.734375 | 1 | |||||
| Nonwhite regional population | percent | 0.14380095465729 | 0.093467743953257 | 0.64702833034125 | |||||
| combined_score | county | 131.49808009531 | high |
| category | applies_to | indicator | sub-text | data_type | raw_data | raw_data_state_average | normalized_data | category_score | simplified_category_score |
|---|---|---|---|---|---|---|---|---|---|
| individual | county | High School Graduation Rate | percent | 0.9188790560472 | 0.91158384662974 | 0.65837153409478 | 115.33003442337 | average | |
| Credentials held | % of CC participants completing training with occupational certification, certification, or license | percent | 0.0089020771513353 | 0.0060053600924168 | 0.48071216617211 | 115.33003442337 | average | ||
| Training Completion Rate | for Connecting Colorado (CC) participants | percent | 0.75 | 0.69235591265914 | 0.75 | 115.33003442337 | average | ||
| neighborhood | county | Bachelors Degree of higher | % of population | percent | 0.15368731563422 | 0.31919195744088 | 0.11933762124899 | 102.61820194956 | average |
| Cost of Living | indexed to national average | number | 110.3 | 111.7078125 | 0.77755511022044 | 102.61820194956 | average | ||
| Absenteeism | Chronically absent/student body | percent | 0.051470588235294 | 0.14699662849725 | 0.87522281639929 | 102.61820194956 | average | ||
| Crime | Criminal acts per 1,000 residents | number | 0.031224322103533 | 0.032152995153139 | 0.31317995069844 | 102.61820194956 | average | ||
| Unemployment rate | percent | 0.024348568987612 | 0.047095452067673 | 0.92293373422126 | 102.61820194956 | average | |||
| Labor force participation rate | percent | 0.59964139344262 | 0.61374589071264 | 0.59337369805195 | 102.61820194956 | average | |||
| industry | county | Target Industries - Diversity | relative to county diversity | number | 0 | 0.048480946595015 | 0 | 50.460822866299 | low |
| Target Industries - Employment Change, 1 Year | % change | percent | 0.089545865197045 | -0.054063603534816 | 0.75092095872967 | 50.460822866299 | low | ||
| Target Industries - Employment Change, 5 Years | % change | percent | -0.54946876477553 | -0.021846911546034 | 0.23392335384254 | 50.460822866299 | low | ||
| Related Industries - Diversity | relative to county diversity | number | 0 | 0.071509052995474 | 0 | 50.460822866299 | low | ||
| Related Industries - Employment Change, 1 Year | % change | percent | -0.31603600999622 | -0.02361410833971 | 0.43883713736069 | 50.460822866299 | low | ||
| Related Industries - Employment Change, 5 Years | % change | percent | -0.70499565116293 | -0.037060214673164 | 0.20280863684571 | 50.460822866299 | low | ||
| Target Industries - Employment | per 100,00 workers | number | 0.045279794959419 | 0.21299338245718 | 0.046274434806854 | 50.460822866299 | low | ||
| Target Industries - Income | average annual pay/MHI | number | 0.51217428449381 | 0.83593053070384 | 0.19879641277735 | 50.460822866299 | low | ||
| Related Industries - Employment | per 100,00 workers | number | 0.21333226866824 | 0.38864538870834 | 0.23513809081822 | 50.460822866299 | low | ||
| Related Industries - Income | average annual pay/MHI | number | 0.12639095643048 | 0.30736251703532 | 0.076784138280897 | 50.460822866299 | low | ||
| engagement | county | Decennial Census Participation | percent | 0.62 | 0.57375 | 0.68852459016393 | 119.60424344742 | average | |
| Management Diveristy | relative to regional diversity | number | 2.3485028289232 | 1.9021235388396 | 0.37667050393801 | 119.60424344742 | average | ||
| Sector Survey Partnerships | number | 0 | 0.40625 | 0 | 119.60424344742 | average | |||
| Completed Talent Gap Survey | number | 0.062162162162162 | 0.079886760824699 | 0.044086250486004 | 119.60424344742 | average | |||
| regional_context | region | Poverty | households living below the poverty line | percent | 0.083329707625113 | 0.083092833248716 | 0.62589146108919 | 91.396217679998 | average |
| Median Household Income | dollar | 51588.5 | 57007.9375 | 0.33125061136653 | 91.396217679998 | average | |||
| education_training | region | In-demand Occupations - Training Programs | programs per 100,000 residents | number | 0 | 4.4347320964544E-8 | 0 | 178.04285914933 | average |
| In-demand Occupations - Postsecondary Education Programs | programs per 100,000 residents | number | 0 | 7.6006736827312E-6 | 0 | 178.04285914933 | average | ||
| Opportunity Occupations - Training Programs | programs per 100,000 residents | number | 0.00045592705167173 | 0.00014929954550687 | 0.92574996696181 | 178.04285914933 | average | ||
| Opportunity Occupations - Postsecondary Education Programs | programs per 100,000 residents | number | 0.00058027079303675 | 0.00038785139598413 | 0.33760477111541 | 178.04285914933 | average | ||
| regional_job_opportunities | region | In-demand Occupations - Program completers | per 100,00 workers | number | 0 | 0 | 118.77648488107 | average | |
| Opportunity Occupations - Program completers | per 100,00 workers | number | 0.0071843050566455 | 0.0050575085821559 | 0.2690571214518 | 118.77648488107 | average | ||
| In-demand Occupations - Job Openings | per 100,00 workers | number | 0.00027798597471882 | 0.00027291351906945 | 0.36090158046303 | 118.77648488107 | average | ||
| In-demand Occupations - Wages | median annual wages (bottom quartile)/MHI | number | 0.5623995637991 | 0.58812061720987 | 0.37176969266038 | 118.77648488107 | average | ||
| In-demand Occupations - Diversity | relative to regional diversity | number | 3.6647444484152 | 3.0176038430139 | 0.70374355250865 | 118.77648488107 | average | ||
| Opportunity Occupations - Job Openings | per 100,00 workers | number | 0.00029310114736792 | 0.00030772934015918 | 0.39085700148553 | 118.77648488107 | average | ||
| Opportunity Occupations - Wages | median annual wages (bottom quartile)/MHI | number | 0.54244879741318 | 0.5527573256027 | 0.43437821196521 | 118.77648488107 | average | ||
| Opportunity Occupations - Diversity | relative to regional diversity | number | 2.4632052762224 | 2.0802233709678 | 0.78927701876734 | 118.77648488107 | average | ||
| Automation Risk | local automation index risk for frontline occupations | number | 105.22803120036 | 105.894645296 | 0.79985857993278 | 118.77648488107 | average | ||
| not directly part of a score | Nonwhite county population | percent | 0.046631059983566 | 0.093467743953257 | 0.095819964620408 | ||||
| Population | number | 72380 | 573818.40625 | 0.016328327799553 | |||||
| Labor force | number | 36321 | 319974.734375 | 0.015212902679743 | |||||
| Nonwhite regional population | percent | 0.063897415198856 | 0.093467743953257 | 0.10374119883716 | |||||
| combined_score | county | 110.88983777101 | average |
| category | applies_to | indicator | sub-text | data_type | raw_data | raw_data_state_average | normalized_data | category_score | simplified_category_score |
|---|---|---|---|---|---|---|---|---|---|
| individual | county | High School Graduation Rate | percent | 0.88579596749925 | 0.91158384662974 | 0.49041586878706 | 125.09251905506 | average | |
| Credentials held | % of CC participants completing training with occupational certification, certification, or license | percent | 0.012027491408935 | 0.0060053600924168 | 0.64948453608247 | 125.09251905506 | average | ||
| Training Completion Rate | for Connecting Colorado (CC) participants | percent | 0.90909090909091 | 0.69235591265914 | 0.90909090909091 | 125.09251905506 | average | ||
| neighborhood | county | Bachelors Degree of higher | % of population | percent | 0.21757448089076 | 0.31919195744088 | 0.23979497592839 | 91.349252810343 | average |
| Cost of Living | indexed to national average | number | 115.8 | 111.7078125 | 0.66733466933867 | 91.349252810343 | average | ||
| Absenteeism | Chronically absent/student body | percent | 0.16514745308311 | 0.14699662849725 | 0.59964253798034 | 91.349252810343 | average | ||
| Crime | Criminal acts per 1,000 residents | number | 0.012796161151655 | 0.032152995153139 | 0.12834549635109 | 91.349252810343 | average | ||
| Unemployment rate | percent | 0.037994516255386 | 0.047095452067673 | 0.81961406490394 | 91.349252810343 | average | |||
| Labor force participation rate | percent | 0.67691899774625 | 0.61374589071264 | 0.75136357193579 | 91.349252810343 | average | |||
| industry | county | Target Industries - Diversity | relative to county diversity | number | 0.014928465268962 | 0.048480946595015 | 0.058609358638815 | 84.79337738163 | average |
| Target Industries - Employment Change, 1 Year | % change | percent | -0.081123115963764 | -0.054063603534816 | 0.63329496513691 | 84.79337738163 | average | ||
| Target Industries - Employment Change, 5 Years | % change | percent | -0.19047172525536 | -0.021846911546034 | 0.42032062208581 | 84.79337738163 | average | ||
| Related Industries - Diversity | relative to county diversity | number | 0 | 0.071509052995474 | 0 | 84.79337738163 | average | ||
| Related Industries - Employment Change, 1 Year | % change | percent | -0.10964431471586 | -0.02361410833971 | 0.57125981173474 | 84.79337738163 | average | ||
| Related Industries - Employment Change, 5 Years | % change | percent | 0.19974211661204 | -0.037060214673164 | 0.82479483504448 | 84.79337738163 | average | ||
| Target Industries - Employment | per 100,00 workers | number | 0.13200156678418 | 0.21299338245718 | 0.13490118279094 | 84.79337738163 | average | ||
| Target Industries - Income | average annual pay/MHI | number | 0.84136310223267 | 0.83593053070384 | 0.47944615080997 | 84.79337738163 | average | ||
| Related Industries - Employment | per 100,00 workers | number | 0.34760293721887 | 0.38864538870834 | 0.38313327623005 | 84.79337738163 | average | ||
| Related Industries - Income | average annual pay/MHI | number | 0.18264281351052 | 0.30736251703532 | 0.16332209482698 | 84.79337738163 | average | ||
| engagement | county | Decennial Census Participation | percent | 0.67 | 0.57375 | 0.77049180327869 | 150.24245897124 | high | |
| Management Diveristy | relative to regional diversity | number | 3.2111880799949 | 1.9021235388396 | 0.56756716193131 | 150.24245897124 | high | ||
| Sector Survey Partnerships | number | 0 | 0.40625 | 0 | 150.24245897124 | high | |||
| Completed Talent Gap Survey | number | 0.021545667447307 | 0.079886760824699 | 0.0140219838377 | 150.24245897124 | high | |||
| regional_context | region | Poverty | households living below the poverty line | percent | 0.083329707625113 | 0.083092833248716 | 0.62589146108919 | 91.396217679998 | average |
| Median Household Income | dollar | 51588.5 | 57007.9375 | 0.33125061136653 | 91.396217679998 | average | |||
| education_training | region | In-demand Occupations - Training Programs | programs per 100,000 residents | number | 0 | 4.4347320964544E-8 | 0 | 178.04285914933 | average |
| In-demand Occupations - Postsecondary Education Programs | programs per 100,000 residents | number | 0 | 7.6006736827312E-6 | 0 | 178.04285914933 | average | ||
| Opportunity Occupations - Training Programs | programs per 100,000 residents | number | 0.00045592705167173 | 0.00014929954550687 | 0.92574996696181 | 178.04285914933 | average | ||
| Opportunity Occupations - Postsecondary Education Programs | programs per 100,000 residents | number | 0.00058027079303675 | 0.00038785139598413 | 0.33760477111541 | 178.04285914933 | average | ||
| regional_job_opportunities | region | In-demand Occupations - Program completers | per 100,00 workers | number | 0 | 0 | 118.77648488107 | average | |
| Opportunity Occupations - Program completers | per 100,00 workers | number | 0.0071843050566455 | 0.0050575085821559 | 0.2690571214518 | 118.77648488107 | average | ||
| In-demand Occupations - Job Openings | per 100,00 workers | number | 0.00027798597471882 | 0.00027291351906945 | 0.36090158046303 | 118.77648488107 | average | ||
| In-demand Occupations - Wages | median annual wages (bottom quartile)/MHI | number | 0.5623995637991 | 0.58812061720987 | 0.37176969266038 | 118.77648488107 | average | ||
| In-demand Occupations - Diversity | relative to regional diversity | number | 3.6647444484152 | 3.0176038430139 | 0.70374355250865 | 118.77648488107 | average | ||
| Opportunity Occupations - Job Openings | per 100,00 workers | number | 0.00029310114736792 | 0.00030772934015918 | 0.39085700148553 | 118.77648488107 | average | ||
| Opportunity Occupations - Wages | median annual wages (bottom quartile)/MHI | number | 0.54244879741318 | 0.5527573256027 | 0.43437821196521 | 118.77648488107 | average | ||
| Opportunity Occupations - Diversity | relative to regional diversity | number | 2.4632052762224 | 2.0802233709678 | 0.78927701876734 | 118.77648488107 | average | ||
| Automation Risk | local automation index risk for frontline occupations | number | 105.22803120036 | 105.894645296 | 0.79985857993278 | 118.77648488107 | average | ||
| not directly part of a score | Nonwhite county population | percent | 0.041587523742877 | 0.093467743953257 | 0.076657340002767 | ||||
| Population | number | 72380 | 573818.40625 | 0.016328327799553 | |||||
| Labor force | number | 36321 | 319974.734375 | 0.015212902679743 | |||||
| Nonwhite regional population | percent | 0.063897415198856 | 0.093467743953257 | 0.10374119883716 | |||||
| combined_score | county | 119.95616713267 | high |
| category | applies_to | indicator | sub-text | data_type | raw_data | raw_data_state_average | normalized_data | category_score | simplified_category_score |
|---|---|---|---|---|---|---|---|---|---|
| individual | county | High School Graduation Rate | percent | 0.90545625587959 | 0.91158384662974 | 0.59022688885779 | 144.46252992441 | high | |
| Credentials held | % of CC participants completing training with occupational certification, certification, or license | percent | 0.016652726028439 | 0.0060053600924168 | 0.8992472055357 | 144.46252992441 | high | ||
| Training Completion Rate | for Connecting Colorado (CC) participants | percent | 0.87679425837321 | 0.69235591265914 | 0.87679425837321 | 144.46252992441 | high | ||
| neighborhood | county | Bachelors Degree of higher | % of population | percent | 0.28214333710907 | 0.31919195744088 | 0.36153763869171 | 105.13425417172 | average |
| Cost of Living | indexed to national average | number | 102.4 | 111.7078125 | 0.93587174348697 | 105.13425417172 | average | ||
| Absenteeism | Chronically absent/student body | percent | 0.14652061308538 | 0.14699662849725 | 0.64479851373241 | 105.13425417172 | average | ||
| Crime | Criminal acts per 1,000 residents | number | 0.050490021029243 | 0.032152995153139 | 0.5064149109233 | 105.13425417172 | average | ||
| Unemployment rate | percent | 0.066650857014874 | 0.047095452067673 | 0.60264388372006 | 105.13425417172 | average | |||
| Labor force participation rate | percent | 0.62178368681035 | 0.61374589071264 | 0.63864241682487 | 105.13425417172 | average | |||
| industry | county | Target Industries - Diversity | relative to county diversity | number | 0.10252792493009 | 0.048480946595015 | 0.40252603428799 | 131.16739678851 | high |
| Target Industries - Employment Change, 1 Year | % change | percent | 0.010364833033885 | -0.054063603534816 | 0.6963489590696 | 131.16739678851 | high | ||
| Target Industries - Employment Change, 5 Years | % change | percent | 0.16569380757126 | -0.021846911546034 | 0.60524772468816 | 131.16739678851 | high | ||
| Related Industries - Diversity | relative to county diversity | number | 0.15608594202176 | 0.071509052995474 | 0.46625569739149 | 131.16739678851 | high | ||
| Related Industries - Employment Change, 1 Year | % change | percent | 0.062817353005214 | -0.02361410833971 | 0.68191269064836 | 131.16739678851 | high | ||
| Related Industries - Employment Change, 5 Years | % change | percent | 0.12991064399919 | -0.037060214673164 | 0.77678731981506 | 131.16739678851 | high | ||
| Target Industries - Employment | per 100,00 workers | number | 0.21310093145198 | 0.21299338245718 | 0.21778201885836 | 131.16739678851 | high | ||
| Target Industries - Income | average annual pay/MHI | number | 0.88238936537423 | 0.83593053070384 | 0.51442306795504 | 131.16739678851 | high | ||
| Related Industries - Employment | per 100,00 workers | number | 0.55944040159627 | 0.38864538870834 | 0.61662377088624 | 131.16739678851 | high | ||
| Related Industries - Income | average annual pay/MHI | number | 0.53007909135232 | 0.30736251703532 | 0.69781867991973 | 131.16739678851 | high | ||
| engagement | county | Decennial Census Participation | percent | 0.76 | 0.57375 | 0.91803278688525 | 135.1976224426 | high | |
| Management Diveristy | relative to regional diversity | number | 1.9389185400617 | 1.9021235388396 | 0.28603690169073 | 135.1976224426 | high | ||
| Sector Survey Partnerships | number | 1 | 0.40625 | 0.66666666666667 | 135.1976224426 | high | |||
| Completed Talent Gap Survey | number | 0.002602120974077 | 0.079886760824699 | 0 | 135.1976224426 | high | |||
| regional_context | region | Poverty | households living below the poverty line | percent | 0.090304082133026 | 0.083092833248716 | 0.57522332927336 | 99.729359059507 | average |
| Median Household Income | dollar | 57229 | 57007.9375 | 0.46918712706642 | 99.729359059507 | average | |||
| education_training | region | In-demand Occupations - Training Programs | programs per 100,000 residents | number | 0 | 4.4347320964544E-8 | 0 | 103.97729296803 | average |
| In-demand Occupations - Postsecondary Education Programs | programs per 100,000 residents | number | 1.9618922057946E-5 | 7.6006736827312E-6 | 0.1369727741679 | 103.97729296803 | average | ||
| Opportunity Occupations - Training Programs | programs per 100,000 residents | number | 0.00012163731675927 | 0.00014929954550687 | 0.2469819273902 | 103.97729296803 | average | ||
| Opportunity Occupations - Postsecondary Education Programs | programs per 100,000 residents | number | 0.00060818658379634 | 0.00038785139598413 | 0.35384633326706 | 103.97729296803 | average | ||
| regional_job_opportunities | region | In-demand Occupations - Program completers | per 100,00 workers | number | 0 | 0 | 104.64671724365 | average | |
| Opportunity Occupations - Program completers | per 100,00 workers | number | 0.0020835295225539 | 0.0050575085821559 | 0.07802960082822 | 104.64671724365 | average | ||
| In-demand Occupations - Job Openings | per 100,00 workers | number | 0.00030198182838435 | 0.00027291351906945 | 0.45219474699251 | 104.64671724365 | average | ||
| In-demand Occupations - Wages | median annual wages (bottom quartile)/MHI | number | 0.61853201857625 | 0.58812061720987 | 0.56600164877562 | 104.64671724365 | average | ||
| In-demand Occupations - Diversity | relative to regional diversity | number | 3.1675742100043 | 3.0176038430139 | 0.50094921234435 | 104.64671724365 | average | ||
| Opportunity Occupations - Job Openings | per 100,00 workers | number | 0.00031399342251871 | 0.00030772934015918 | 0.46395365067794 | 104.64671724365 | average | ||
| Opportunity Occupations - Wages | median annual wages (bottom quartile)/MHI | number | 0.54267032448584 | 0.5527573256027 | 0.43508842239832 | 104.64671724365 | average | ||
| Opportunity Occupations - Diversity | relative to regional diversity | number | 1.9686832815708 | 2.0802233709678 | 0.43151210427533 | 104.64671724365 | average | ||
| Automation Risk | local automation index risk for frontline occupations | number | 105.64062818134 | 105.894645296 | 0.70201282021977 | 104.64671724365 | average | ||
| not directly part of a score | Nonwhite county population | percent | 0.059880437514053 | 0.093467743953257 | 0.14616020922613 | ||||
| Population | number | 254856 | 573818.40625 | 0.074256352365536 | |||||
| Labor force | number | 133393 | 319974.734375 | 0.069266595539479 | |||||
| Nonwhite regional population | percent | 0.07484153512029 | 0.093467743953257 | 0.17815341585849 | |||||
| combined_score | county | 117.7593103712 | average |
| category | applies_to | indicator | sub-text | data_type | raw_data | raw_data_state_average | normalized_data | category_score | simplified_category_score |
|---|---|---|---|---|---|---|---|---|---|
| individual | county | High School Graduation Rate | percent | 0.90710088368546 | 0.91158384662974 | 0.5985763075319 | 131.84929437191 | high | |
| Credentials held | % of CC participants completing training with occupational certification, certification, or license | percent | 0.012841530054645 | 0.0060053600924168 | 0.69344262295082 | 131.84929437191 | high | ||
| Training Completion Rate | for Connecting Colorado (CC) participants | percent | 0.86764705882353 | 0.69235591265914 | 0.86764705882353 | 131.84929437191 | high | ||
| neighborhood | county | Bachelors Degree of higher | % of population | percent | 0.21688422374736 | 0.31919195744088 | 0.23849351656315 | 86.770089763484 | average |
| Cost of Living | indexed to national average | number | 103.9 | 111.7078125 | 0.90581162324649 | 86.770089763484 | average | ||
| Absenteeism | Chronically absent/student body | percent | 0.15242679502607 | 0.14699662849725 | 0.63048049690649 | 86.770089763484 | average | ||
| Crime | Criminal acts per 1,000 residents | number | 0.033600523474562 | 0.032152995153139 | 0.33701325044986 | 86.770089763484 | average | ||
| Unemployment rate | percent | 0.066146540027137 | 0.047095452067673 | 0.60646229686365 | 86.770089763484 | average | |||
| Labor force participation rate | percent | 0.46940806496557 | 0.61374589071264 | 0.32711871606881 | 86.770089763484 | average | |||
| industry | county | Target Industries - Diversity | relative to county diversity | number | 0.020318282830745 | 0.048480946595015 | 0.079769856036568 | 91.425138467515 | average |
| Target Industries - Employment Change, 1 Year | % change | percent | -0.012553229063284 | -0.054063603534816 | 0.6805537055498 | 91.425138467515 | average | ||
| Target Industries - Employment Change, 5 Years | % change | percent | -0.074106894719319 | -0.021846911546034 | 0.48073918865811 | 91.425138467515 | average | ||
| Related Industries - Diversity | relative to county diversity | number | 0.016137838265631 | 0.071509052995474 | 0.048206513267439 | 91.425138467515 | average | ||
| Related Industries - Employment Change, 1 Year | % change | percent | -0.11511117518638 | -0.02361410833971 | 0.56775222736729 | 91.425138467515 | average | ||
| Related Industries - Employment Change, 5 Years | % change | percent | 0.057335303822288 | -0.037060214673164 | 0.72689345937566 | 91.425138467515 | average | ||
| Target Industries - Employment | per 100,00 workers | number | 0.16748643147897 | 0.21299338245718 | 0.17116552673112 | 91.425138467515 | average | ||
| Target Industries - Income | average annual pay/MHI | number | 0.79121438263229 | 0.83593053070384 | 0.43669188863548 | 91.425138467515 | average | ||
| Related Industries - Employment | per 100,00 workers | number | 0.40642050851576 | 0.38864538870834 | 0.44796290330734 | 91.425138467515 | average | ||
| Related Industries - Income | average annual pay/MHI | number | 0.28208818396695 | 0.30736251703532 | 0.31630902884096 | 91.425138467515 | average | ||
| engagement | county | Decennial Census Participation | percent | 0.65 | 0.57375 | 0.73770491803279 | 124.31182386441 | average | |
| Management Diveristy | relative to regional diversity | number | 2.3157182794523 | 1.9021235388396 | 0.36941587553208 | 124.31182386441 | average | ||
| Sector Survey Partnerships | number | 0 | 0.40625 | 0 | 124.31182386441 | average | |||
| Completed Talent Gap Survey | number | 0.014278017241379 | 0.079886760824699 | 0.0086424803814921 | 124.31182386441 | average | |||
| regional_context | region | Poverty | households living below the poverty line | percent | 0.069232467274052 | 0.083092833248716 | 0.72830649938925 | 112.54667125801 | average |
| Median Household Income | dollar | 56458 | 57007.9375 | 0.45033258339039 | 112.54667125801 | average | |||
| education_training | region | In-demand Occupations - Training Programs | programs per 100,000 residents | number | 0 | 4.4347320964544E-8 | 0 | 24.736362724562 | average |
| In-demand Occupations - Postsecondary Education Programs | programs per 100,000 residents | number | 0 | 7.6006736827312E-6 | 0 | 24.736362724562 | average | ||
| Opportunity Occupations - Training Programs | programs per 100,000 residents | number | 0 | 0.00014929954550687 | 0 | 24.736362724562 | average | ||
| Opportunity Occupations - Postsecondary Education Programs | programs per 100,000 residents | number | 0.0003016884823123 | 0.00038785139598413 | 0.17552403505642 | 24.736362724562 | average | ||
| regional_job_opportunities | region | In-demand Occupations - Program completers | per 100,00 workers | number | 0 | 0 | 119.85406659605 | average | |
| Opportunity Occupations - Program completers | per 100,00 workers | number | 0 | 0.0050575085821559 | 0 | 119.85406659605 | average | ||
| In-demand Occupations - Job Openings | per 100,00 workers | number | 0.00030809722315893 | 0.00027291351906945 | 0.47546100629426 | 119.85406659605 | average | ||
| In-demand Occupations - Wages | median annual wages (bottom quartile)/MHI | number | 0.59141935348755 | 0.58812061720987 | 0.47218522837173 | 119.85406659605 | average | ||
| In-demand Occupations - Diversity | relative to regional diversity | number | 4.3910462204998 | 3.0176038430139 | 1 | 119.85406659605 | average | ||
| Opportunity Occupations - Job Openings | per 100,00 workers | number | 0.00033869894908574 | 0.00030772934015918 | 0.55039187703433 | 119.85406659605 | average | ||
| Opportunity Occupations - Wages | median annual wages (bottom quartile)/MHI | number | 0.53091970179337 | 0.5527573256027 | 0.39741621045704 | 119.85406659605 | average | ||
| Opportunity Occupations - Diversity | relative to regional diversity | number | 2.7544779661285 | 2.0802233709678 | 1 | 119.85406659605 | average | ||
| Automation Risk | local automation index risk for frontline occupations | number | 107.49706923391 | 105.894645296 | 0.26176508810736 | 119.85406659605 | average | ||
| not directly part of a score | Nonwhite county population | percent | 0.055586455095698 | 0.093467743953257 | 0.12984547106011 | ||||
| Population | number | 102755 | 573818.40625 | 0.025971041067006 | |||||
| Labor force | number | 48962 | 319974.734375 | 0.022251932795944 | |||||
| Nonwhite regional population | percent | 0.048639757702347 | 0.093467743953257 | 0 | |||||
| combined_score | county | 98.78477814942 | average |
| category | applies_to | indicator | sub-text | data_type | raw_data | raw_data_state_average | normalized_data | category_score | simplified_category_score |
|---|---|---|---|---|---|---|---|---|---|
| individual | county | High School Graduation Rate | percent | 0.89012245996501 | 0.91158384662974 | 0.51238053268121 | 104.5125831072 | average | |
| Credentials held | % of CC participants completing training with occupational certification, certification, or license | percent | 0.0064382139148494 | 0.0060053600924168 | 0.34766355140187 | 104.5125831072 | average | ||
| Training Completion Rate | for Connecting Colorado (CC) participants | percent | 0.85185185185185 | 0.69235591265914 | 0.85185185185185 | 104.5125831072 | average | ||
| neighborhood | county | Bachelors Degree of higher | % of population | percent | 0.25188399946171 | 0.31919195744088 | 0.30448455529516 | 93.336681102292 | average |
| Cost of Living | indexed to national average | number | 104.5 | 111.7078125 | 0.8937875751503 | 93.336681102292 | average | ||
| Absenteeism | Chronically absent/student body | percent | 0.20837892762232 | 0.14699662849725 | 0.49483896333982 | 93.336681102292 | average | ||
| Crime | Criminal acts per 1,000 residents | number | 0.043491819795615 | 0.032152995153139 | 0.43622295255002 | 93.336681102292 | average | ||
| Unemployment rate | percent | 0.062735523592166 | 0.047095452067673 | 0.63228865271727 | 93.336681102292 | average | |||
| Labor force participation rate | percent | 0.56092768465867 | 0.61374589071264 | 0.51422561856024 | 93.336681102292 | average | |||
| industry | county | Target Industries - Diversity | relative to county diversity | number | 0.048236359035557 | 0.048480946595015 | 0.18937660470855 | 112.65116236812 | average |
| Target Industries - Employment Change, 1 Year | % change | percent | -0.018662481352502 | -0.054063603534816 | 0.67634317551827 | 112.65116236812 | average | ||
| Target Industries - Employment Change, 5 Years | % change | percent | -0.058062437491999 | -0.021846911546034 | 0.48906973924319 | 112.65116236812 | average | ||
| Related Industries - Diversity | relative to county diversity | number | 0.095978589864655 | 0.071509052995474 | 0.28670464343135 | 112.65116236812 | average | ||
| Related Industries - Employment Change, 1 Year | % change | percent | 0.024560863522892 | -0.02361410833971 | 0.65736700026809 | 112.65116236812 | average | ||
| Related Industries - Employment Change, 5 Years | % change | percent | 0.21802270292572 | -0.037060214673164 | 0.83736231347533 | 112.65116236812 | average | ||
| Target Industries - Employment | per 100,00 workers | number | 0.20444774693488 | 0.21299338245718 | 0.20893875392822 | 112.65116236812 | average | ||
| Target Industries - Income | average annual pay/MHI | number | 0.87675813385701 | 0.83593053070384 | 0.50962216475011 | 112.65116236812 | average | ||
| Related Industries - Employment | per 100,00 workers | number | 0.5154944641407 | 0.38864538870834 | 0.56818588618635 | 112.65116236812 | average | ||
| Related Industries - Income | average annual pay/MHI | number | 0.36999323090761 | 0.30736251703532 | 0.45154230872197 | 112.65116236812 | average | ||
| engagement | county | Decennial Census Participation | percent | 0.7 | 0.57375 | 0.81967213114754 | 135.7238922044 | high | |
| Management Diveristy | relative to regional diversity | number | 2.404603255357 | 1.9021235388396 | 0.38908451461561 | 135.7238922044 | high | ||
| Sector Survey Partnerships | number | 0 | 0.40625 | 0 | 135.7238922044 | high | |||
| Completed Talent Gap Survey | number | 0.0092592592592593 | 0.079886760824699 | 0.0049276034755198 | 135.7238922044 | high | |||
| regional_context | region | Poverty | households living below the poverty line | percent | 0.069232467274052 | 0.083092833248716 | 0.72830649938925 | 112.54667125801 | average |
| Median Household Income | dollar | 56458 | 57007.9375 | 0.45033258339039 | 112.54667125801 | average | |||
| education_training | region | In-demand Occupations - Training Programs | programs per 100,000 residents | number | 0 | 4.4347320964544E-8 | 0 | 24.736362724562 | average |
| In-demand Occupations - Postsecondary Education Programs | programs per 100,000 residents | number | 0 | 7.6006736827312E-6 | 0 | 24.736362724562 | average | ||
| Opportunity Occupations - Training Programs | programs per 100,000 residents | number | 0 | 0.00014929954550687 | 0 | 24.736362724562 | average | ||
| Opportunity Occupations - Postsecondary Education Programs | programs per 100,000 residents | number | 0.0003016884823123 | 0.00038785139598413 | 0.17552403505642 | 24.736362724562 | average | ||
| regional_job_opportunities | region | In-demand Occupations - Program completers | per 100,00 workers | number | 0 | 0 | 119.85406659605 | average | |
| Opportunity Occupations - Program completers | per 100,00 workers | number | 0 | 0.0050575085821559 | 0 | 119.85406659605 | average | ||
| In-demand Occupations - Job Openings | per 100,00 workers | number | 0.00030809722315893 | 0.00027291351906945 | 0.47546100629426 | 119.85406659605 | average | ||
| In-demand Occupations - Wages | median annual wages (bottom quartile)/MHI | number | 0.59141935348755 | 0.58812061720987 | 0.47218522837173 | 119.85406659605 | average | ||
| In-demand Occupations - Diversity | relative to regional diversity | number | 4.3910462204998 | 3.0176038430139 | 1 | 119.85406659605 | average | ||
| Opportunity Occupations - Job Openings | per 100,00 workers | number | 0.00033869894908574 | 0.00030772934015918 | 0.55039187703433 | 119.85406659605 | average | ||
| Opportunity Occupations - Wages | median annual wages (bottom quartile)/MHI | number | 0.53091970179337 | 0.5527573256027 | 0.39741621045704 | 119.85406659605 | average | ||
| Opportunity Occupations - Diversity | relative to regional diversity | number | 2.7544779661285 | 2.0802233709678 | 1 | 119.85406659605 | average | ||
| Automation Risk | local automation index risk for frontline occupations | number | 107.49706923391 | 105.894645296 | 0.26176508810736 | 119.85406659605 | average | ||
| not directly part of a score | Nonwhite county population | percent | 0.058340929808569 | 0.093467743953257 | 0.14031093862545 | ||||
| Population | number | 102755 | 573818.40625 | 0.025971041067006 | |||||
| Labor force | number | 48962 | 319974.734375 | 0.022251932795944 | |||||
| Nonwhite regional population | percent | 0.048639757702347 | 0.093467743953257 | 0 | |||||
| combined_score | county | 100.48020276581 | average |
| category | applies_to | indicator | sub-text | data_type | raw_data | raw_data_state_average | normalized_data | category_score | simplified_category_score |
|---|---|---|---|---|---|---|---|---|---|
| individual | county | High School Graduation Rate | percent | 0.96809389981815 | 0.91158384662974 | 0.90822462192199 | 55.447822082005 | low | |
| Credentials held | % of CC participants completing training with occupational certification, certification, or license | percent | 0 | 0.0060053600924168 | 0 | 55.447822082005 | low | ||
| Training Completion Rate | for Connecting Colorado (CC) participants | percent | 0 | 0.69235591265914 | 0 | 55.447822082005 | low | ||
| neighborhood | county | Bachelors Degree of higher | % of population | percent | 0.59398247644239 | 0.31919195744088 | 0.949501084225 | 111.98824165521 | average |
| Cost of Living | indexed to national average | number | 127.6 | 111.7078125 | 0.43086172344689 | 111.98824165521 | average | ||
| Absenteeism | Chronically absent/student body | percent | 0.18249733191035 | 0.14699662849725 | 0.55758222567187 | 111.98824165521 | average | ||
| Crime | Criminal acts per 1,000 residents | number | 0.012423903590508 | 0.032152995153139 | 0.1246117530128 | 111.98824165521 | average | ||
| Unemployment rate | percent | 0.025229357798165 | 0.047095452067673 | 0.91626488178771 | 111.98824165521 | average | |||
| Labor force participation rate | percent | 0.77488151658768 | 0.61374589071264 | 0.95164263255843 | 111.98824165521 | average | |||
| industry | county | Target Industries - Diversity | relative to county diversity | number | 0.012091005274962 | 0.048480946595015 | 0.047469451929356 | 110.36220766566 | average |
| Target Industries - Employment Change, 1 Year | % change | percent | 0.026788586540428 | -0.054063603534816 | 0.7076682996527 | 110.36220766566 | average | ||
| Target Industries - Employment Change, 5 Years | % change | percent | 0.097835417205719 | -0.021846911546034 | 0.57001451327108 | 110.36220766566 | average | ||
| Related Industries - Diversity | relative to county diversity | number | 0.057133542778517 | 0.071509052995474 | 0.17066777114963 | 110.36220766566 | average | ||
| Related Industries - Employment Change, 1 Year | % change | percent | -0.019895616414445 | -0.02361410833971 | 0.62884334306104 | 110.36220766566 | average | ||
| Related Industries - Employment Change, 5 Years | % change | percent | -0.0243125929033 | -0.037060214673164 | 0.67076242706542 | 110.36220766566 | average | ||
| Target Industries - Employment | per 100,00 workers | number | 0.53497706422018 | 0.21299338245718 | 0.54672865245096 | 110.36220766566 | average | ||
| Target Industries - Income | average annual pay/MHI | number | 1.118501529052 | 0.83593053070384 | 0.71572035787405 | 110.36220766566 | average | ||
| Related Industries - Employment | per 100,00 workers | number | 0.5077816561751 | 0.38864538870834 | 0.55968471122955 | 110.36220766566 | average | ||
| Related Industries - Income | average annual pay/MHI | number | 0.17912353192717 | 0.30736251703532 | 0.15790802580699 | 110.36220766566 | average | ||
| engagement | county | Decennial Census Participation | percent | 0.33 | 0.57375 | 0.21311475409836 | 56.226291727287 | low | |
| Management Diveristy | relative to regional diversity | number | 1.9461471385235 | 1.9021235388396 | 0.28763645991505 | 56.226291727287 | low | ||
| Sector Survey Partnerships | number | 0 | 0.40625 | 0 | 56.226291727287 | low | |||
| Completed Talent Gap Survey | number | 0.018714689265537 | 0.079886760824699 | 0.011926498160519 | 56.226291727287 | low | |||
| regional_context | region | Poverty | households living below the poverty line | percent | 0.069232467274052 | 0.083092833248716 | 0.72830649938925 | 112.54667125801 | average |
| Median Household Income | dollar | 56458 | 57007.9375 | 0.45033258339039 | 112.54667125801 | average | |||
| education_training | region | In-demand Occupations - Training Programs | programs per 100,000 residents | number | 0 | 4.4347320964544E-8 | 0 | 24.736362724562 | average |
| In-demand Occupations - Postsecondary Education Programs | programs per 100,000 residents | number | 0 | 7.6006736827312E-6 | 0 | 24.736362724562 | average | ||
| Opportunity Occupations - Training Programs | programs per 100,000 residents | number | 0 | 0.00014929954550687 | 0 | 24.736362724562 | average | ||
| Opportunity Occupations - Postsecondary Education Programs | programs per 100,000 residents | number | 0.0003016884823123 | 0.00038785139598413 | 0.17552403505642 | 24.736362724562 | average | ||
| regional_job_opportunities | region | In-demand Occupations - Program completers | per 100,00 workers | number | 0 | 0 | 119.85406659605 | average | |
| Opportunity Occupations - Program completers | per 100,00 workers | number | 0 | 0.0050575085821559 | 0 | 119.85406659605 | average | ||
| In-demand Occupations - Job Openings | per 100,00 workers | number | 0.00030809722315893 | 0.00027291351906945 | 0.47546100629426 | 119.85406659605 | average | ||
| In-demand Occupations - Wages | median annual wages (bottom quartile)/MHI | number | 0.59141935348755 | 0.58812061720987 | 0.47218522837173 | 119.85406659605 | average | ||
| In-demand Occupations - Diversity | relative to regional diversity | number | 4.3910462204998 | 3.0176038430139 | 1 | 119.85406659605 | average | ||
| Opportunity Occupations - Job Openings | per 100,00 workers | number | 0.00033869894908574 | 0.00030772934015918 | 0.55039187703433 | 119.85406659605 | average | ||
| Opportunity Occupations - Wages | median annual wages (bottom quartile)/MHI | number | 0.53091970179337 | 0.5527573256027 | 0.39741621045704 | 119.85406659605 | average | ||
| Opportunity Occupations - Diversity | relative to regional diversity | number | 2.7544779661285 | 2.0802233709678 | 1 | 119.85406659605 | average | ||
| Automation Risk | local automation index risk for frontline occupations | number | 107.49706923391 | 105.894645296 | 0.26176508810736 | 119.85406659605 | average | ||
| not directly part of a score | Nonwhite county population | percent | 0.053422785439185 | 0.093467743953257 | 0.12162473317984 | ||||
| Population | number | 102755 | 573818.40625 | 0.025971041067006 | |||||
| Labor force | number | 48962 | 319974.734375 | 0.022251932795944 | |||||
| Nonwhite regional population | percent | 0.048639757702347 | 0.093467743953257 | 0 | |||||
| combined_score | county | 84.451666244112 | average |
| category | applies_to | indicator | sub-text | data_type | raw_data | raw_data_state_average | normalized_data | category_score | simplified_category_score |
|---|---|---|---|---|---|---|---|---|---|
| individual | county | High School Graduation Rate | percent | 0.97766813814594 | 0.91158384662974 | 0.95683095339637 | 119.46605710696 | average | |
| Credentials held | % of CC participants completing training with occupational certification, certification, or license | percent | 0 | 0.0060053600924168 | 0 | 119.46605710696 | average | ||
| Training Completion Rate | for Connecting Colorado (CC) participants | percent | 1 | 0.69235591265914 | 1 | 119.46605710696 | average | ||
| neighborhood | county | Bachelors Degree of higher | % of population | percent | 0.47779797455206 | 0.31919195744088 | 0.73043865288605 | 104.3654566804 | average |
| Cost of Living | indexed to national average | number | 116.5 | 111.7078125 | 0.65330661322645 | 104.3654566804 | average | ||
| Absenteeism | Chronically absent/student body | percent | 0.062962962962963 | 0.14699662849725 | 0.84736251402918 | 104.3654566804 | average | ||
| Crime | Criminal acts per 1,000 residents | number | 0.0047956630525438 | 0.032152995153139 | 0.048100500417014 | 104.3654566804 | average | ||
| Unemployment rate | percent | 0.038000826104915 | 0.047095452067673 | 0.81956629016511 | 104.3654566804 | average | |||
| Labor force participation rate | percent | 0.58534816247582 | 0.61374589071264 | 0.56415196197218 | 104.3654566804 | average | |||
| industry | county | Target Industries - Diversity | relative to county diversity | number | 0.0051443420130754 | 0.048480946595015 | 0.02019675703918 | 107.54162658583 | average |
| Target Industries - Employment Change, 1 Year | % change | percent | -0.072503634338208 | -0.054063603534816 | 0.63923555893178 | 107.54162658583 | average | ||
| Target Industries - Employment Change, 5 Years | % change | percent | 0.075145026535575 | -0.021846911546034 | 0.5582332828689 | 107.54162658583 | average | ||
| Related Industries - Diversity | relative to county diversity | number | 0.012486318456552 | 0.071509052995474 | 0.037298792219225 | 107.54162658583 | average | ||
| Related Industries - Employment Change, 1 Year | % change | percent | 0.036032143463657 | -0.02361410833971 | 0.66472707144821 | 107.54162658583 | average | ||
| Related Industries - Employment Change, 5 Years | % change | percent | 0.14454174644326 | -0.037060214673164 | 0.78684586286342 | 107.54162658583 | average | ||
| Target Industries - Employment | per 100,00 workers | number | 0.3304419661297 | 0.21299338245718 | 0.3377006285656 | 107.54162658583 | average | ||
| Target Industries - Income | average annual pay/MHI | number | 0.81288723667906 | 0.83593053070384 | 0.45516906794073 | 107.54162658583 | average | ||
| Related Industries - Employment | per 100,00 workers | number | 0.35664563791399 | 0.38864538870834 | 0.3931002793026 | 107.54162658583 | average | ||
| Related Industries - Income | average annual pay/MHI | number | 0.57109087819599 | 0.30736251703532 | 0.76091128542615 | 107.54162658583 | average | ||
| engagement | county | Decennial Census Participation | percent | 0.47 | 0.57375 | 0.44262295081967 | 130.28642634166 | average | |
| Management Diveristy | relative to regional diversity | number | 3.8896911781654 | 1.9021235388396 | 0.71770763751954 | 130.28642634166 | average | ||
| Sector Survey Partnerships | number | 0 | 0.40625 | 0 | 130.28642634166 | average | |||
| Completed Talent Gap Survey | number | 0.038629737609329 | 0.079886760824699 | 0.026667586182146 | 130.28642634166 | average | |||
| regional_context | region | Poverty | households living below the poverty line | percent | 0.069232467274052 | 0.083092833248716 | 0.72830649938925 | 112.54667125801 | average |
| Median Household Income | dollar | 56458 | 57007.9375 | 0.45033258339039 | 112.54667125801 | average | |||
| education_training | region | In-demand Occupations - Training Programs | programs per 100,000 residents | number | 0 | 4.4347320964544E-8 | 0 | 24.736362724562 | average |
| In-demand Occupations - Postsecondary Education Programs | programs per 100,000 residents | number | 0 | 7.6006736827312E-6 | 0 | 24.736362724562 | average | ||
| Opportunity Occupations - Training Programs | programs per 100,000 residents | number | 0 | 0.00014929954550687 | 0 | 24.736362724562 | average | ||
| Opportunity Occupations - Postsecondary Education Programs | programs per 100,000 residents | number | 0.0003016884823123 | 0.00038785139598413 | 0.17552403505642 | 24.736362724562 | average | ||
| regional_job_opportunities | region | In-demand Occupations - Program completers | per 100,00 workers | number | 0 | 0 | 119.85406659605 | average | |
| Opportunity Occupations - Program completers | per 100,00 workers | number | 0 | 0.0050575085821559 | 0 | 119.85406659605 | average | ||
| In-demand Occupations - Job Openings | per 100,00 workers | number | 0.00030809722315893 | 0.00027291351906945 | 0.47546100629426 | 119.85406659605 | average | ||
| In-demand Occupations - Wages | median annual wages (bottom quartile)/MHI | number | 0.59141935348755 | 0.58812061720987 | 0.47218522837173 | 119.85406659605 | average | ||
| In-demand Occupations - Diversity | relative to regional diversity | number | 4.3910462204998 | 3.0176038430139 | 1 | 119.85406659605 | average | ||
| Opportunity Occupations - Job Openings | per 100,00 workers | number | 0.00033869894908574 | 0.00030772934015918 | 0.55039187703433 | 119.85406659605 | average | ||
| Opportunity Occupations - Wages | median annual wages (bottom quartile)/MHI | number | 0.53091970179337 | 0.5527573256027 | 0.39741621045704 | 119.85406659605 | average | ||
| Opportunity Occupations - Diversity | relative to regional diversity | number | 2.7544779661285 | 2.0802233709678 | 1 | 119.85406659605 | average | ||
| Automation Risk | local automation index risk for frontline occupations | number | 107.49706923391 | 105.894645296 | 0.26176508810736 | 119.85406659605 | average | ||
| not directly part of a score | Nonwhite county population | percent | 0.023352793994996 | 0.093467743953257 | 0.0073755376150319 | ||||
| Population | number | 102755 | 573818.40625 | 0.025971041067006 | |||||
| Labor force | number | 48962 | 319974.734375 | 0.022251932795944 | |||||
| Nonwhite regional population | percent | 0.048639757702347 | 0.093467743953257 | 0 | |||||
| combined_score | county | 102.68523818478 | average |
| category | applies_to | indicator | sub-text | data_type | raw_data | raw_data_state_average | normalized_data | category_score | simplified_category_score |
|---|---|---|---|---|---|---|---|---|---|
| individual | county | High School Graduation Rate | percent | 0.96893274853801 | 0.91158384662974 | 0.91248327493839 | 86.792947079056 | average | |
| Credentials held | % of CC participants completing training with occupational certification, certification, or license | percent | 0.0014925373134328 | 0.0060053600924168 | 0.080597014925371 | 86.792947079056 | average | ||
| Training Completion Rate | for Connecting Colorado (CC) participants | percent | 0.42857142857143 | 0.69235591265914 | 0.42857142857143 | 86.792947079056 | average | ||
| neighborhood | county | Bachelors Degree of higher | % of population | percent | 0.60789473684211 | 0.31919195744088 | 0.97573223845812 | 100.25087267941 | average |
| Cost of Living | indexed to national average | number | 149.1 | 111.7078125 | 0 | 100.25087267941 | average | ||
| Absenteeism | Chronically absent/student body | percent | 0.25509259259259 | 0.14699662849725 | 0.38159371492705 | 100.25087267941 | average | ||
| Crime | Criminal acts per 1,000 residents | number | 0.02811558629923 | 0.032152995153139 | 0.28199933058128 | 100.25087267941 | average | ||
| Unemployment rate | percent | 0.030125862768981 | 0.047095452067673 | 0.87919121702352 | 100.25087267941 | average | |||
| Labor force participation rate | percent | 0.79853456101673 | 0.61374589071264 | 1 | 100.25087267941 | average | |||
| industry | county | Target Industries - Diversity | relative to county diversity | number | 0.04171625050867 | 0.048480946595015 | 0.16377856953672 | 126.03714873081 | average |
| Target Industries - Employment Change, 1 Year | % change | percent | 0.0017848273887506 | -0.054063603534816 | 0.69043557233596 | 126.03714873081 | average | ||
| Target Industries - Employment Change, 5 Years | % change | percent | -0.11263863401319 | -0.021846911546034 | 0.46073286505545 | 126.03714873081 | average | ||
| Related Industries - Diversity | relative to county diversity | number | 0.074026375213414 | 0.071509052995474 | 0.2211295825455 | 126.03714873081 | average | ||
| Related Industries - Employment Change, 1 Year | % change | percent | -0.023724653539751 | -0.02361410833971 | 0.62638660013966 | 126.03714873081 | average | ||
| Related Industries - Employment Change, 5 Years | % change | percent | -0.049448496225767 | -0.037060214673164 | 0.65348207744071 | 126.03714873081 | average | ||
| Target Industries - Employment | per 100,00 workers | number | 0.64912708079578 | 0.21299338245718 | 0.66338614847016 | 126.03714873081 | average | ||
| Target Industries - Income | average annual pay/MHI | number | 1.4246853430775 | 0.83593053070384 | 0.97675719316615 | 126.03714873081 | average | ||
| Related Industries - Employment | per 100,00 workers | number | 0.56698127151031 | 0.38864538870834 | 0.62493543309171 | 126.03714873081 | average | ||
| Related Industries - Income | average annual pay/MHI | number | 0.31875133164802 | 0.30736251703532 | 0.37271168015881 | 126.03714873081 | average | ||
| engagement | county | Decennial Census Participation | percent | 0.4 | 0.57375 | 0.32786885245902 | 56.740381431659 | low | |
| Management Diveristy | relative to regional diversity | number | 1.4482501057322 | 1.9021235388396 | 0.17746084318047 | 56.740381431659 | low | ||
| Sector Survey Partnerships | number | 0 | 0.40625 | 0 | 56.740381431659 | low | |||
| Completed Talent Gap Survey | number | 0.007093147751606 | 0.079886760824699 | 0.0033242510835117 | 56.740381431659 | low | |||
| regional_context | region | Poverty | households living below the poverty line | percent | 0.031834360086817 | 0.083092833248716 | 1 | 190.97732783913 | high |
| Median Household Income | dollar | 78935 | 57007.9375 | 1 | 190.97732783913 | high | |||
| education_training | region | In-demand Occupations - Training Programs | programs per 100,000 residents | number | 0 | 4.4347320964544E-8 | 0 | 0 | low |
| In-demand Occupations - Postsecondary Education Programs | programs per 100,000 residents | number | 0 | 7.6006736827312E-6 | 0 | 0 | low | ||
| Opportunity Occupations - Training Programs | programs per 100,000 residents | number | 0 | 0.00014929954550687 | 0 | 0 | low | ||
| Opportunity Occupations - Postsecondary Education Programs | programs per 100,000 residents | number | 0 | 0.00038785139598413 | 0 | 0 | low | ||
| regional_job_opportunities | region | In-demand Occupations - Program completers | per 100,00 workers | number | 0 | 0 | 99.069112450835 | average | |
| Opportunity Occupations - Program completers | per 100,00 workers | number | 0 | 0.0050575085821559 | 0 | 99.069112450835 | average | ||
| In-demand Occupations - Job Openings | per 100,00 workers | number | 0.00044596910791564 | 0.00027291351906945 | 1 | 99.069112450835 | average | ||
| In-demand Occupations - Wages | median annual wages (bottom quartile)/MHI | number | 0.50135793557991 | 0.58812061720987 | 0.16055080154748 | 99.069112450835 | average | ||
| In-demand Occupations - Diversity | relative to regional diversity | number | 3.6717291141108 | 3.0176038430139 | 0.70659257797633 | 99.069112450835 | average | ||
| Opportunity Occupations - Job Openings | per 100,00 workers | number | 0.00046720465651295 | 0.00030772934015918 | 1 | 99.069112450835 | average | ||
| Opportunity Occupations - Wages | median annual wages (bottom quartile)/MHI | number | 0.40695862543739 | 0.5527573256027 | 0 | 99.069112450835 | average | ||
| Opportunity Occupations - Diversity | relative to regional diversity | number | 2.1589142312022 | 2.0802233709678 | 0.56913583014528 | 99.069112450835 | average | ||
| Automation Risk | local automation index risk for frontline occupations | number | 108.60088288301 | 105.894645296 | 0 | 99.069112450835 | average | ||
| not directly part of a score | Nonwhite county population | percent | 0.088530625906504 | 0.093467743953257 | 0.25501494510769 | ||||
| Population | number | 119820 | 573818.40625 | 0.031388420553725 | |||||
| Labor force | number | 77223 | 319974.734375 | 0.037988823082629 | |||||
| Nonwhite regional population | percent | 0.072056675409729 | 0.093467743953257 | 0.15921835423235 | |||||
| combined_score | county | 94.266827172985 | average |
| category | applies_to | indicator | sub-text | data_type | raw_data | raw_data_state_average | normalized_data | category_score | simplified_category_score |
|---|---|---|---|---|---|---|---|---|---|
| individual | county | High School Graduation Rate | percent | 0.83731799388819 | 0.91158384662974 | 0.24430371094501 | 71.364220840806 | low | |
| Credentials held | % of CC participants completing training with occupational certification, certification, or license | percent | 0.0047770700636942 | 0.0060053600924168 | 0.25796178343949 | 71.364220840806 | low | ||
| Training Completion Rate | for Connecting Colorado (CC) participants | percent | 0.66666666666667 | 0.69235591265914 | 0.66666666666667 | 71.364220840806 | low | ||
| neighborhood | county | Bachelors Degree of higher | % of population | percent | 0.32338666187309 | 0.31919195744088 | 0.43930070392254 | 89.831670696153 | average |
| Cost of Living | indexed to national average | number | 109.3 | 111.7078125 | 0.79759519038076 | 89.831670696153 | average | ||
| Absenteeism | Chronically absent/student body | percent | 0.31563981042654 | 0.14699662849725 | 0.23481258078414 | 89.831670696153 | average | ||
| Crime | Criminal acts per 1,000 residents | number | 0.013933685976003 | 0.032152995153139 | 0.13975487033931 | 89.831670696153 | average | ||
| Unemployment rate | percent | 0.041037204058625 | 0.047095452067673 | 0.79657649253922 | 89.831670696153 | average | |||
| Labor force participation rate | percent | 0.6737049977214 | 0.61374589071264 | 0.74479272307 | 89.831670696153 | average | |||
| industry | county | Target Industries - Diversity | relative to county diversity | number | 0.016076645930755 | 0.048480946595015 | 0.063117131606547 | 84.346901265108 | average |
| Target Industries - Employment Change, 1 Year | % change | percent | -0.21116185326197 | -0.054063603534816 | 0.54367155743731 | 84.346901265108 | average | ||
| Target Industries - Employment Change, 5 Years | % change | percent | -0.18293356580597 | -0.021846911546034 | 0.42423456057072 | 84.346901265108 | average | ||
| Related Industries - Diversity | relative to county diversity | number | 0 | 0.071509052995474 | 0 | 84.346901265108 | average | ||
| Related Industries - Employment Change, 1 Year | % change | percent | 0.055404722110019 | -0.02361410833971 | 0.67715668335865 | 84.346901265108 | average | ||
| Related Industries - Employment Change, 5 Years | % change | percent | 0.40385994832482 | -0.037060214673164 | 0.96512110266989 | 84.346901265108 | average | ||
| Target Industries - Employment | per 100,00 workers | number | 0.14746335963923 | 0.21299338245718 | 0.15070261753926 | 84.346901265108 | average | ||
| Target Industries - Income | average annual pay/MHI | number | 0.54746335963923 | 0.83593053070384 | 0.22888209358208 | 84.346901265108 | average | ||
| Related Industries - Employment | per 100,00 workers | number | 0.52814529153894 | 0.38864538870834 | 0.58212982172063 | 84.346901265108 | average | ||
| Related Industries - Income | average annual pay/MHI | number | 0.086065460298626 | 0.30736251703532 | 0.01474732362085 | 84.346901265108 | average | ||
| engagement | county | Decennial Census Participation | percent | 0.47 | 0.57375 | 0.44262295081967 | 57.193670535088 | low | |
| Management Diveristy | relative to regional diversity | number | 0.94790601366838 | 1.9021235388396 | 0.066743736445406 | 57.193670535088 | low | ||
| Sector Survey Partnerships | number | 1.5 | 0.40625 | 1 | 57.193670535088 | low | |||
| Completed Talent Gap Survey | number | 0.089795918367347 | 0.079886760824699 | 0.064540714143672 | 57.193670535088 | low | |||
| regional_context | region | Poverty | households living below the poverty line | percent | 0.084434611085284 | 0.083092833248716 | 0.61786444818643 | 91.221687670605 | average |
| Median Household Income | dollar | 51842 | 57007.9375 | 0.33744986794483 | 91.221687670605 | average | |||
| education_training | region | In-demand Occupations - Training Programs | programs per 100,000 residents | number | 0 | 4.4347320964544E-8 | 0 | 0 | low |
| In-demand Occupations - Postsecondary Education Programs | programs per 100,000 residents | number | 0 | 7.6006736827312E-6 | 0 | 0 | low | ||
| Opportunity Occupations - Training Programs | programs per 100,000 residents | number | 0 | 0.00014929954550687 | 0 | 0 | low | ||
| Opportunity Occupations - Postsecondary Education Programs | programs per 100,000 residents | number | 0 | 0.00038785139598413 | 0 | 0 | low | ||
| regional_job_opportunities | region | In-demand Occupations - Program completers | per 100,00 workers | number | 0 | 0 | 73.719074202173 | average | |
| Opportunity Occupations - Program completers | per 100,00 workers | number | 0 | 0.0050575085821559 | 0 | 73.719074202173 | average | ||
| In-demand Occupations - Job Openings | per 100,00 workers | number | 0.00028628813613513 | 0.00027291351906945 | 0.39248747923114 | 73.719074202173 | average | ||
| In-demand Occupations - Wages | median annual wages (bottom quartile)/MHI | number | 0.63633644482273 | 0.58812061720987 | 0.62760929716894 | 73.719074202173 | average | ||
| In-demand Occupations - Diversity | relative to regional diversity | number | 1.9394480249676 | 3.0176038430139 | 0 | 73.719074202173 | average | ||
| Opportunity Occupations - Job Openings | per 100,00 workers | number | 0.00033258602588992 | 0.00030772934015918 | 0.52900434508004 | 73.719074202173 | average | ||
| Opportunity Occupations - Wages | median annual wages (bottom quartile)/MHI | number | 0.57687190890398 | 0.5527573256027 | 0.54473787423149 | 73.719074202173 | average | ||
| Opportunity Occupations - Diversity | relative to regional diversity | number | 1.3722239366808 | 2.0802233709678 | 0 | 73.719074202173 | average | ||
| Automation Risk | local automation index risk for frontline occupations | number | 106.64783787638 | 105.894645296 | 0.4631569818459 | 73.719074202173 | average | ||
| not directly part of a score | Nonwhite county population | percent | 0.1466907495807 | 0.093467743953257 | 0.47599097551527 | ||||
| Population | number | 79405 | 573818.40625 | 0.018558453254824 | |||||
| Labor force | number | 30110 | 319974.734375 | 0.011754361737434 | |||||
| Nonwhite regional population | percent | 0.095418434279457 | 0.093467743953257 | 0.31806166767315 | |||||
| combined_score | county | 66.811032172848 | low |
| category | applies_to | indicator | sub-text | data_type | raw_data | raw_data_state_average | normalized_data | category_score | simplified_category_score |
|---|---|---|---|---|---|---|---|---|---|
| individual | county | High School Graduation Rate | percent | 0.97377605886237 | 0.91158384662974 | 0.93707171101021 | 118.25973993623 | average | |
| Credentials held | % of CC participants completing training with occupational certification, certification, or license | percent | 0 | 0.0060053600924168 | 0 | 118.25973993623 | average | ||
| Training Completion Rate | for Connecting Colorado (CC) participants | percent | 1 | 0.69235591265914 | 1 | 118.25973993623 | average | ||
| neighborhood | county | Bachelors Degree of higher | % of population | percent | 0.56211678143571 | 0.31919195744088 | 0.88941926168505 | 114.42869708983 | high |
| Cost of Living | indexed to national average | number | 110.8 | 111.7078125 | 0.76753507014028 | 114.42869708983 | high | ||
| Absenteeism | Chronically absent/student body | percent | 0.19373493975904 | 0.14699662849725 | 0.53033953997809 | 114.42869708983 | high | ||
| Crime | Criminal acts per 1,000 residents | number | 0.026782525889775 | 0.032152995153139 | 0.26862873467444 | 114.42869708983 | high | ||
| Unemployment rate | percent | 0.051202180473085 | 0.047095452067673 | 0.71961283577349 | 114.42869708983 | high | |||
| Labor force participation rate | percent | 0.72055832222768 | 0.61374589071264 | 0.84058180577371 | 114.42869708983 | high | |||
| industry | county | Target Industries - Diversity | relative to county diversity | number | 0.015606150825481 | 0.048480946595015 | 0.061269961394072 | 106.3974892517 | average |
| Target Industries - Employment Change, 1 Year | % change | percent | -0.051259513372356 | -0.054063603534816 | 0.65387712308489 | 106.3974892517 | average | ||
| Target Industries - Employment Change, 5 Years | % change | percent | -0.14979851352546 | -0.021846911546034 | 0.44143883399994 | 106.3974892517 | average | ||
| Related Industries - Diversity | relative to county diversity | number | 0.023151980260138 | 0.071509052995474 | 0.06915896820919 | 106.3974892517 | average | ||
| Related Industries - Employment Change, 1 Year | % change | percent | 0.054226615799974 | -0.02361410833971 | 0.67640080028854 | 106.3974892517 | average | ||
| Related Industries - Employment Change, 5 Years | % change | percent | 0.16655164740282 | -0.037060214673164 | 0.80197715848097 | 106.3974892517 | average | ||
| Target Industries - Employment | per 100,00 workers | number | 0.33096466465492 | 0.21299338245718 | 0.33823480896219 | 106.3974892517 | average | ||
| Target Industries - Income | average annual pay/MHI | number | 0.87296797430157 | 0.83593053070384 | 0.50639086639179 | 106.3974892517 | average | ||
| Related Industries - Employment | per 100,00 workers | number | 0.6411218339608 | 0.38864538870834 | 0.70665429548241 | 106.3974892517 | average | ||
| Related Industries - Income | average annual pay/MHI | number | 0.30301830543625 | 0.30736251703532 | 0.34850796477364 | 106.3974892517 | average | ||
| engagement | county | Decennial Census Participation | percent | 0.41 | 0.57375 | 0.34426229508197 | 86.212306730419 | average | |
| Management Diveristy | relative to regional diversity | number | 2.5603311952472 | 1.9021235388396 | 0.42354429382744 | 86.212306730419 | average | ||
| Sector Survey Partnerships | number | 0 | 0.40625 | 0 | 86.212306730419 | average | |||
| Completed Talent Gap Survey | number | 0.010807504078303 | 0.079886760824699 | 0.006073611899028 | 86.212306730419 | average | |||
| regional_context | region | Poverty | households living below the poverty line | percent | 0.069232467274052 | 0.083092833248716 | 0.72830649938925 | 112.54667125801 | average |
| Median Household Income | dollar | 56458 | 57007.9375 | 0.45033258339039 | 112.54667125801 | average | |||
| education_training | region | In-demand Occupations - Training Programs | programs per 100,000 residents | number | 0 | 4.4347320964544E-8 | 0 | 24.736362724562 | average |
| In-demand Occupations - Postsecondary Education Programs | programs per 100,000 residents | number | 0 | 7.6006736827312E-6 | 0 | 24.736362724562 | average | ||
| Opportunity Occupations - Training Programs | programs per 100,000 residents | number | 0 | 0.00014929954550687 | 0 | 24.736362724562 | average | ||
| Opportunity Occupations - Postsecondary Education Programs | programs per 100,000 residents | number | 0.0003016884823123 | 0.00038785139598413 | 0.17552403505642 | 24.736362724562 | average | ||
| regional_job_opportunities | region | In-demand Occupations - Program completers | per 100,00 workers | number | 0 | 0 | 119.85406659605 | average | |
| Opportunity Occupations - Program completers | per 100,00 workers | number | 0 | 0.0050575085821559 | 0 | 119.85406659605 | average | ||
| In-demand Occupations - Job Openings | per 100,00 workers | number | 0.00030809722315893 | 0.00027291351906945 | 0.47546100629426 | 119.85406659605 | average | ||
| In-demand Occupations - Wages | median annual wages (bottom quartile)/MHI | number | 0.59141935348755 | 0.58812061720987 | 0.47218522837173 | 119.85406659605 | average | ||
| In-demand Occupations - Diversity | relative to regional diversity | number | 4.3910462204998 | 3.0176038430139 | 1 | 119.85406659605 | average | ||
| Opportunity Occupations - Job Openings | per 100,00 workers | number | 0.00033869894908574 | 0.00030772934015918 | 0.55039187703433 | 119.85406659605 | average | ||
| Opportunity Occupations - Wages | median annual wages (bottom quartile)/MHI | number | 0.53091970179337 | 0.5527573256027 | 0.39741621045704 | 119.85406659605 | average | ||
| Opportunity Occupations - Diversity | relative to regional diversity | number | 2.7544779661285 | 2.0802233709678 | 1 | 119.85406659605 | average | ||
| Automation Risk | local automation index risk for frontline occupations | number | 107.49706923391 | 105.894645296 | 0.26176508810736 | 119.85406659605 | average | ||
| not directly part of a score | Nonwhite county population | percent | 0.04279252469944 | 0.093467743953257 | 0.08123567153298 | ||||
| Population | number | 102755 | 573818.40625 | 0.025971041067006 | |||||
| Labor force | number | 48962 | 319974.734375 | 0.022251932795944 | |||||
| Nonwhite regional population | percent | 0.048639757702347 | 0.093467743953257 | 0 | |||||
| combined_score | county | 97.490761940971 | average |
| category | applies_to | indicator | sub-text | data_type | raw_data | raw_data_state_average | normalized_data | category_score | simplified_category_score |
|---|---|---|---|---|---|---|---|---|---|
| individual | county | High School Graduation Rate | percent | 0.93848354792561 | 0.91158384662974 | 0.7578992874267 | 123.24741420159 | average | |
| Credentials held | % of CC participants completing training with occupational certification, certification, or license | percent | 0.0048309178743961 | 0.0060053600924168 | 0.26086956521739 | 123.24741420159 | average | ||
| Training Completion Rate | for Connecting Colorado (CC) participants | percent | 1 | 0.69235591265914 | 1 | 123.24741420159 | average | ||
| neighborhood | county | Bachelors Degree of higher | % of population | percent | 0.24105865522175 | 0.31919195744088 | 0.28407368989826 | 103.95140760705 | average |
| Cost of Living | indexed to national average | number | 106.1 | 111.7078125 | 0.86172344689379 | 103.95140760705 | average | ||
| Absenteeism | Chronically absent/student body | percent | 0 | 0.14699662849725 | 1 | 103.95140760705 | average | ||
| Crime | Criminal acts per 1,000 residents | number | 0.017770597738288 | 0.032152995153139 | 0.17823909531502 | 103.95140760705 | average | ||
| Unemployment rate | percent | 0.038834951456311 | 0.047095452067673 | 0.813250747991 | 103.95140760705 | average | |||
| Labor force participation rate | percent | 0.55940257976918 | 0.61374589071264 | 0.51110762426782 | 103.95140760705 | average | |||
| industry | county | Target Industries - Diversity | relative to county diversity | number | 0 | 0.048480946595015 | 0 | 71.852159035278 | low |
| Target Industries - Employment Change, 1 Year | % change | percent | -0.12690186941674 | -0.054063603534816 | 0.60174399832548 | 71.852159035278 | low | ||
| Target Industries - Employment Change, 5 Years | % change | percent | 0.089108870125647 | -0.021846911546034 | 0.56548354404889 | 71.852159035278 | low | ||
| Related Industries - Diversity | relative to county diversity | number | 0 | 0.071509052995474 | 0 | 71.852159035278 | low | ||
| Related Industries - Employment Change, 1 Year | % change | percent | -0.022314970620056 | -0.02361410833971 | 0.62729106474029 | 71.852159035278 | low | ||
| Related Industries - Employment Change, 5 Years | % change | percent | -0.037060214673164 | 0.68747676990253 | 71.852159035278 | low | |||
| Target Industries - Employment | per 100,00 workers | number | 0.080097087378641 | 0.21299338245718 | 0.081856542226916 | 71.852159035278 | low | ||
| Target Industries - Income | average annual pay/MHI | number | 0.6626213592233 | 0.83593053070384 | 0.32705998017501 | 71.852159035278 | low | ||
| Related Industries - Employment | per 100,00 workers | number | 0.15153426723513 | 0.38864538870834 | 0.16702338803989 | 71.852159035278 | low | ||
| Related Industries - Income | average annual pay/MHI | number | 0.10974071173758 | 0.30736251703532 | 0.051169372360087 | 71.852159035278 | low | ||
| engagement | county | Decennial Census Participation | percent | 0.39 | 0.57375 | 0.31147540983607 | 94.319934097915 | average | |
| Management Diveristy | relative to regional diversity | number | 3.0348091339474 | 1.9021235388396 | 0.52853768820493 | 94.319934097915 | average | ||
| Sector Survey Partnerships | number | 1 | 0.40625 | 0.66666666666667 | 94.319934097915 | average | |||
| Completed Talent Gap Survey | number | 0.10697674418605 | 0.079886760824699 | 0.077257934875735 | 94.319934097915 | average | |||
| regional_context | region | Poverty | households living below the poverty line | percent | 0.055513514448656 | 0.083092833248716 | 0.82797331672802 | 112.16972196859 | average |
| Median Household Income | dollar | 52221 | 57007.9375 | 0.34671818448596 | 112.16972196859 | average | |||
| education_training | region | In-demand Occupations - Training Programs | programs per 100,000 residents | number | 0 | 4.4347320964544E-8 | 0 | 21.899181659034 | average |
| In-demand Occupations - Postsecondary Education Programs | programs per 100,000 residents | number | 0 | 7.6006736827312E-6 | 0 | 21.899181659034 | average | ||
| Opportunity Occupations - Training Programs | programs per 100,000 residents | number | 0 | 0.00014929954550687 | 0 | 21.899181659034 | average | ||
| Opportunity Occupations - Postsecondary Education Programs | programs per 100,000 residents | number | 0.00026708578589993 | 0.00038785139598413 | 0.1553919940465 | 21.899181659034 | average | ||
| regional_job_opportunities | region | In-demand Occupations - Program completers | per 100,00 workers | number | 0 | 0 | 68.850339776203 | low | |
| Opportunity Occupations - Program completers | per 100,00 workers | number | 0 | 0.0050575085821559 | 0 | 68.850339776203 | low | ||
| In-demand Occupations - Job Openings | per 100,00 workers | number | 0.00027977871060955 | 0.00027291351906945 | 0.36772211448099 | 68.850339776203 | low | ||
| In-demand Occupations - Wages | median annual wages (bottom quartile)/MHI | number | 0.60985040659505 | 0.58812061720987 | 0.53596115822454 | 68.850339776203 | low | ||
| In-demand Occupations - Diversity | relative to regional diversity | number | 2.0374089121924 | 3.0176038430139 | 0.039957970030868 | 68.850339776203 | low | ||
| Opportunity Occupations - Job Openings | per 100,00 workers | number | 0.00032058919811073 | 0.00030772934015918 | 0.48703055786596 | 68.850339776203 | low | ||
| Opportunity Occupations - Wages | median annual wages (bottom quartile)/MHI | number | 0.56926064227035 | 0.5527573256027 | 0.52033633762635 | 68.850339776203 | low | ||
| Opportunity Occupations - Diversity | relative to regional diversity | number | 1.4055624761785 | 2.0802233709678 | 0.024118967127234 | 68.850339776203 | low | ||
| Automation Risk | local automation index risk for frontline occupations | number | 106.85936764961 | 105.894645296 | 0.41299352375569 | 68.850339776203 | low | ||
| not directly part of a score | Nonwhite county population | percent | 0.03338718362951 | 0.093467743953257 | 0.045500621416766 | ||||
| Population | number | 97347 | 573818.40625 | 0.024254241285924 | |||||
| Labor force | number | 49997 | 319974.734375 | 0.022828263479456 | |||||
| Nonwhite regional population | percent | 0.10618834841076 | 0.093467743953257 | 0.39128940945528 | |||||
| combined_score | county | 85.184308335094 | average |
| category | applies_to | indicator | sub-text | data_type | raw_data | raw_data_state_average | normalized_data | category_score | simplified_category_score |
|---|---|---|---|---|---|---|---|---|---|
| individual | county | High School Graduation Rate | percent | 0.90049430474962 | 0.91158384662974 | 0.56503613914743 | 117.0036637209 | average | |
| Credentials held | % of CC participants completing training with occupational certification, certification, or license | percent | 0.0086556169429097 | 0.0060053600924168 | 0.46740331491712 | 117.0036637209 | average | ||
| Training Completion Rate | for Connecting Colorado (CC) participants | percent | 0.88405797101449 | 0.69235591265914 | 0.88405797101449 | 117.0036637209 | average | ||
| neighborhood | county | Bachelors Degree of higher | % of population | percent | 0.29604556200301 | 0.31919195744088 | 0.38774987127642 | 90.975439794733 | average |
| Cost of Living | indexed to national average | number | 105 | 111.7078125 | 0.88376753507014 | 90.975439794733 | average | ||
| Absenteeism | Chronically absent/student body | percent | 0.29100926621588 | 0.14699662849725 | 0.29452299099181 | 90.975439794733 | average | ||
| Crime | Criminal acts per 1,000 residents | number | 0.038569398025431 | 0.032152995153139 | 0.38685106219508 | 90.975439794733 | average | ||
| Unemployment rate | percent | 0.05103681760474 | 0.047095452067673 | 0.72086487321284 | 90.975439794733 | average | |||
| Labor force participation rate | percent | 0.56337020789624 | 0.61374589071264 | 0.51921922494517 | 90.975439794733 | average | |||
| industry | county | Target Industries - Diversity | relative to county diversity | number | 0.044451144781066 | 0.048480946595015 | 0.17451580182164 | 111.63428103959 | average |
| Target Industries - Employment Change, 1 Year | % change | percent | -0.12378692838352 | -0.054063603534816 | 0.60389083269177 | 111.63428103959 | average | ||
| Target Industries - Employment Change, 5 Years | % change | percent | 0.015081727576094 | -0.021846911546034 | 0.52704741330661 | 111.63428103959 | average | ||
| Related Industries - Diversity | relative to county diversity | number | 0.027725215513827 | 0.071509052995474 | 0.08282001266281 | 111.63428103959 | average | ||
| Related Industries - Employment Change, 1 Year | % change | percent | -0.014145472039037 | -0.02361410833971 | 0.63253268480124 | 111.63428103959 | average | ||
| Related Industries - Employment Change, 5 Years | % change | percent | 0.13774705283166 | -0.037060214673164 | 0.78217466884684 | 111.63428103959 | average | ||
| Target Industries - Employment | per 100,00 workers | number | 0.21862039779941 | 0.21299338245718 | 0.22342272871341 | 111.63428103959 | average | ||
| Target Industries - Income | average annual pay/MHI | number | 0.80770207363521 | 0.83593053070384 | 0.4507484601573 | 111.63428103959 | average | ||
| Related Industries - Employment | per 100,00 workers | number | 0.78592278148373 | 0.38864538870834 | 0.86625611550599 | 111.63428103959 | average | ||
| Related Industries - Income | average annual pay/MHI | number | 0.39310828111313 | 0.30736251703532 | 0.48710254289167 | 111.63428103959 | average | ||
| engagement | county | Decennial Census Participation | percent | 0.63 | 0.57375 | 0.70491803278689 | 82.479076741261 | average | |
| Management Diveristy | relative to regional diversity | number | 0.78023160312578 | 1.9021235388396 | 0.029640419141887 | 82.479076741261 | average | ||
| Sector Survey Partnerships | number | 0 | 0.40625 | 0 | 82.479076741261 | average | |||
| Completed Talent Gap Survey | number | 0.0097872340425532 | 0.079886760824699 | 0.00531840959456 | 82.479076741261 | average | |||
| regional_context | region | Poverty | households living below the poverty line | percent | 0.055513514448656 | 0.083092833248716 | 0.82797331672802 | 112.16972196859 | average |
| Median Household Income | dollar | 52221 | 57007.9375 | 0.34671818448596 | 112.16972196859 | average | |||
| education_training | region | In-demand Occupations - Training Programs | programs per 100,000 residents | number | 0 | 4.4347320964544E-8 | 0 | 21.899181659034 | average |
| In-demand Occupations - Postsecondary Education Programs | programs per 100,000 residents | number | 0 | 7.6006736827312E-6 | 0 | 21.899181659034 | average | ||
| Opportunity Occupations - Training Programs | programs per 100,000 residents | number | 0 | 0.00014929954550687 | 0 | 21.899181659034 | average | ||
| Opportunity Occupations - Postsecondary Education Programs | programs per 100,000 residents | number | 0.00026708578589993 | 0.00038785139598413 | 0.1553919940465 | 21.899181659034 | average | ||
| regional_job_opportunities | region | In-demand Occupations - Program completers | per 100,00 workers | number | 0 | 0 | 68.850339776203 | low | |
| Opportunity Occupations - Program completers | per 100,00 workers | number | 0 | 0.0050575085821559 | 0 | 68.850339776203 | low | ||
| In-demand Occupations - Job Openings | per 100,00 workers | number | 0.00027977871060955 | 0.00027291351906945 | 0.36772211448099 | 68.850339776203 | low | ||
| In-demand Occupations - Wages | median annual wages (bottom quartile)/MHI | number | 0.60985040659505 | 0.58812061720987 | 0.53596115822454 | 68.850339776203 | low | ||
| In-demand Occupations - Diversity | relative to regional diversity | number | 2.0374089121924 | 3.0176038430139 | 0.039957970030868 | 68.850339776203 | low | ||
| Opportunity Occupations - Job Openings | per 100,00 workers | number | 0.00032058919811073 | 0.00030772934015918 | 0.48703055786596 | 68.850339776203 | low | ||
| Opportunity Occupations - Wages | median annual wages (bottom quartile)/MHI | number | 0.56926064227035 | 0.5527573256027 | 0.52033633762635 | 68.850339776203 | low | ||
| Opportunity Occupations - Diversity | relative to regional diversity | number | 1.4055624761785 | 2.0802233709678 | 0.024118967127234 | 68.850339776203 | low | ||
| Automation Risk | local automation index risk for frontline occupations | number | 106.85936764961 | 105.894645296 | 0.41299352375569 | 68.850339776203 | low | ||
| not directly part of a score | Nonwhite county population | percent | 0.19031155161154 | 0.093467743953257 | 0.64172569317108 | ||||
| Population | number | 97347 | 573818.40625 | 0.024254241285924 | |||||
| Labor force | number | 49997 | 319974.734375 | 0.022828263479456 | |||||
| Nonwhite regional population | percent | 0.10618834841076 | 0.093467743953257 | 0.39128940945528 | |||||
| combined_score | county | 86.430243528617 | average |
| category | applies_to | indicator | sub-text | data_type | raw_data | raw_data_state_average | normalized_data | category_score | simplified_category_score |
|---|---|---|---|---|---|---|---|---|---|
| individual | county | High School Graduation Rate | percent | 0.95547230533276 | 0.91158384662974 | 0.84414752416356 | 136.2865818062 | high | |
| Credentials held | % of CC participants completing training with occupational certification, certification, or license | percent | 0.0084660350735738 | 0.0060053600924168 | 0.45716589397299 | 136.2865818062 | high | ||
| Training Completion Rate | for Connecting Colorado (CC) participants | percent | 0.93103448275862 | 0.69235591265914 | 0.93103448275862 | 136.2865818062 | high | ||
| neighborhood | county | Bachelors Degree of higher | % of population | percent | 0.44220953913459 | 0.31919195744088 | 0.66333771374822 | 113.34572784804 | average |
| Cost of Living | indexed to national average | number | 108.3 | 111.7078125 | 0.81763527054108 | 113.34572784804 | average | ||
| Absenteeism | Chronically absent/student body | percent | 0.14873509741204 | 0.14699662849725 | 0.63943006687991 | 113.34572784804 | average | ||
| Crime | Criminal acts per 1,000 residents | number | 0.033263210888757 | 0.032152995153139 | 0.33363000521423 | 113.34572784804 | average | ||
| Unemployment rate | percent | 0.040639508271758 | 0.047095452067673 | 0.79958762810802 | 113.34572784804 | average | |||
| Labor force participation rate | percent | 0.66377308535341 | 0.61374589071264 | 0.72448746650073 | 113.34572784804 | average | |||
| industry | county | Target Industries - Diversity | relative to county diversity | number | 0.066950726471009 | 0.048480946595015 | 0.26284946698619 | 108.62437094071 | average |
| Target Industries - Employment Change, 1 Year | % change | percent | 0.043593033123128 | -0.054063603534816 | 0.7192500159823 | 108.62437094071 | average | ||
| Target Industries - Employment Change, 5 Years | % change | percent | 0.050533542161013 | -0.021846911546034 | 0.54545458847921 | 108.62437094071 | average | ||
| Related Industries - Diversity | relative to county diversity | number | 0.14079494652983 | 0.071509052995474 | 0.42057884991532 | 108.62437094071 | average | ||
| Related Industries - Employment Change, 1 Year | % change | percent | -0.035223380833166 | -0.02361410833971 | 0.61900891850367 | 108.62437094071 | average | ||
| Related Industries - Employment Change, 5 Years | % change | percent | -0.058633887849118 | -0.037060214673164 | 0.64716733407719 | 108.62437094071 | average | ||
| Target Industries - Employment | per 100,00 workers | number | 0.25070293598378 | 0.21299338245718 | 0.25621000884535 | 108.62437094071 | average | ||
| Target Industries - Income | average annual pay/MHI | number | 0.88373765775191 | 0.83593053070384 | 0.51557255384945 | 108.62437094071 | average | ||
| Related Industries - Employment | per 100,00 workers | number | 0.27485622770619 | 0.38864538870834 | 0.30295073987536 | 108.62437094071 | average | ||
| Related Industries - Income | average annual pay/MHI | number | 0.34378751480739 | 0.30736251703532 | 0.41122738866675 | 108.62437094071 | average | ||
| engagement | county | Decennial Census Participation | percent | 0.59 | 0.57375 | 0.63934426229508 | 83.966533627713 | average | |
| Management Diveristy | relative to regional diversity | number | 1.1364335647866 | 1.9021235388396 | 0.10846147695785 | 83.966533627713 | average | ||
| Sector Survey Partnerships | number | 0 | 0.40625 | 0 | 83.966533627713 | average | |||
| Completed Talent Gap Survey | number | 0.0034251675353686 | 0.079886760824699 | 0.00060921779332154 | 83.966533627713 | average | |||
| regional_context | region | Poverty | households living below the poverty line | percent | 0.055513514448656 | 0.083092833248716 | 0.82797331672802 | 112.16972196859 | average |
| Median Household Income | dollar | 52221 | 57007.9375 | 0.34671818448596 | 112.16972196859 | average | |||
| education_training | region | In-demand Occupations - Training Programs | programs per 100,000 residents | number | 0 | 4.4347320964544E-8 | 0 | 21.899181659034 | average |
| In-demand Occupations - Postsecondary Education Programs | programs per 100,000 residents | number | 0 | 7.6006736827312E-6 | 0 | 21.899181659034 | average | ||
| Opportunity Occupations - Training Programs | programs per 100,000 residents | number | 0 | 0.00014929954550687 | 0 | 21.899181659034 | average | ||
| Opportunity Occupations - Postsecondary Education Programs | programs per 100,000 residents | number | 0.00026708578589993 | 0.00038785139598413 | 0.1553919940465 | 21.899181659034 | average | ||
| regional_job_opportunities | region | In-demand Occupations - Program completers | per 100,00 workers | number | 0 | 0 | 68.850339776203 | low | |
| Opportunity Occupations - Program completers | per 100,00 workers | number | 0 | 0.0050575085821559 | 0 | 68.850339776203 | low | ||
| In-demand Occupations - Job Openings | per 100,00 workers | number | 0.00027977871060955 | 0.00027291351906945 | 0.36772211448099 | 68.850339776203 | low | ||
| In-demand Occupations - Wages | median annual wages (bottom quartile)/MHI | number | 0.60985040659505 | 0.58812061720987 | 0.53596115822454 | 68.850339776203 | low | ||
| In-demand Occupations - Diversity | relative to regional diversity | number | 2.0374089121924 | 3.0176038430139 | 0.039957970030868 | 68.850339776203 | low | ||
| Opportunity Occupations - Job Openings | per 100,00 workers | number | 0.00032058919811073 | 0.00030772934015918 | 0.48703055786596 | 68.850339776203 | low | ||
| Opportunity Occupations - Wages | median annual wages (bottom quartile)/MHI | number | 0.56926064227035 | 0.5527573256027 | 0.52033633762635 | 68.850339776203 | low | ||
| Opportunity Occupations - Diversity | relative to regional diversity | number | 1.4055624761785 | 2.0802233709678 | 0.024118967127234 | 68.850339776203 | low | ||
| Automation Risk | local automation index risk for frontline occupations | number | 106.85936764961 | 105.894645296 | 0.41299352375569 | 68.850339776203 | low | ||
| not directly part of a score | Nonwhite county population | percent | 0.12034090296132 | 0.093467743953257 | 0.3758762553263 | ||||
| Population | number | 97347 | 573818.40625 | 0.024254241285924 | |||||
| Labor force | number | 49997 | 319974.734375 | 0.022828263479456 | |||||
| Nonwhite regional population | percent | 0.10618834841076 | 0.093467743953257 | 0.39128940945528 | |||||
| combined_score | county | 92.163208232355 | average |
| category | applies_to | indicator | sub-text | data_type | raw_data | raw_data_state_average | normalized_data | category_score | simplified_category_score |
|---|---|---|---|---|---|---|---|---|---|
| individual | county | High School Graduation Rate | percent | 0.93814432989691 | 0.91158384662974 | 0.75617715106654 | 46.165205305804 | low | |
| Credentials held | % of CC participants completing training with occupational certification, certification, or license | percent | 0 | 0.0060053600924168 | 0 | 46.165205305804 | low | ||
| Training Completion Rate | for Connecting Colorado (CC) participants | percent | 0 | 0.69235591265914 | 0 | 46.165205305804 | low | ||
| neighborhood | county | Bachelors Degree of higher | % of population | percent | 0.35670103092784 | 0.31919195744088 | 0.5021139584007 | 118.88236197086 | high |
| Cost of Living | indexed to national average | number | 112.5 | 111.7078125 | 0.73346693386773 | 118.88236197086 | high | ||
| Absenteeism | Chronically absent/student body | percent | 0 | 0.14699662849725 | 1 | 118.88236197086 | high | ||
| Crime | Criminal acts per 1,000 residents | number | 0.023769100169779 | 0.032152995153139 | 0.23840407470289 | 118.88236197086 | high | ||
| Unemployment rate | percent | 0.01994301994302 | 0.047095452067673 | 0.95629014851163 | 118.88236197086 | high | |||
| Labor force participation rate | percent | 0.67241379310345 | 0.61374589071264 | 0.74215292520635 | 118.88236197086 | high | |||
| industry | county | Target Industries - Diversity | relative to county diversity | number | 0 | 0.048480946595015 | 0 | 84.435046518569 | average |
| Target Industries - Employment Change, 1 Year | % change | percent | -0.12345779149498 | -0.054063603534816 | 0.60411767563229 | 84.435046518569 | average | ||
| Target Industries - Employment Change, 5 Years | % change | percent | 0.232086160392 | -0.021846911546034 | 0.63971974488802 | 84.435046518569 | average | ||
| Related Industries - Diversity | relative to county diversity | number | 0 | 0.071509052995474 | 0 | 84.435046518569 | average | ||
| Related Industries - Employment Change, 1 Year | % change | percent | -0.02361410833971 | 0.64160854047047 | 84.435046518569 | average | |||
| Related Industries - Employment Change, 5 Years | % change | percent | -1 | -0.037060214673164 | 0 | 84.435046518569 | average | ||
| Target Industries - Employment | per 100,00 workers | number | 0.5042735042735 | 0.21299338245718 | 0.51535064191968 | 84.435046518569 | average | ||
| Target Industries - Income | average annual pay/MHI | number | 1 | 0.83593053070384 | 0.61469194714812 | 84.435046518569 | average | ||
| Related Industries - Employment | per 100,00 workers | number | 0.45125247902365 | 0.38864538870834 | 0.49737738719509 | 84.435046518569 | average | ||
| Related Industries - Income | average annual pay/MHI | number | 0.16794508009153 | 0.30736251703532 | 0.14071107570758 | 84.435046518569 | average | ||
| engagement | county | Decennial Census Participation | percent | 0.32 | 0.57375 | 0.19672131147541 | 103.46111018721 | average | |
| Management Diveristy | relative to regional diversity | number | 3.9213044260008 | 1.9021235388396 | 0.72470307803808 | 103.46111018721 | average | ||
| Sector Survey Partnerships | number | 0 | 0.40625 | 0 | 103.46111018721 | average | |||
| Completed Talent Gap Survey | number | 0.11219512195122 | 0.079886760824699 | 0.081120570036773 | 103.46111018721 | average | |||
| regional_context | region | Poverty | households living below the poverty line | percent | 0.055513514448656 | 0.083092833248716 | 0.82797331672802 | 112.16972196859 | average |
| Median Household Income | dollar | 52221 | 57007.9375 | 0.34671818448596 | 112.16972196859 | average | |||
| education_training | region | In-demand Occupations - Training Programs | programs per 100,000 residents | number | 0 | 4.4347320964544E-8 | 0 | 21.899181659034 | average |
| In-demand Occupations - Postsecondary Education Programs | programs per 100,000 residents | number | 0 | 7.6006736827312E-6 | 0 | 21.899181659034 | average | ||
| Opportunity Occupations - Training Programs | programs per 100,000 residents | number | 0 | 0.00014929954550687 | 0 | 21.899181659034 | average | ||
| Opportunity Occupations - Postsecondary Education Programs | programs per 100,000 residents | number | 0.00026708578589993 | 0.00038785139598413 | 0.1553919940465 | 21.899181659034 | average | ||
| regional_job_opportunities | region | In-demand Occupations - Program completers | per 100,00 workers | number | 0 | 0 | 68.850339776203 | low | |
| Opportunity Occupations - Program completers | per 100,00 workers | number | 0 | 0.0050575085821559 | 0 | 68.850339776203 | low | ||
| In-demand Occupations - Job Openings | per 100,00 workers | number | 0.00027977871060955 | 0.00027291351906945 | 0.36772211448099 | 68.850339776203 | low | ||
| In-demand Occupations - Wages | median annual wages (bottom quartile)/MHI | number | 0.60985040659505 | 0.58812061720987 | 0.53596115822454 | 68.850339776203 | low | ||
| In-demand Occupations - Diversity | relative to regional diversity | number | 2.0374089121924 | 3.0176038430139 | 0.039957970030868 | 68.850339776203 | low | ||
| Opportunity Occupations - Job Openings | per 100,00 workers | number | 0.00032058919811073 | 0.00030772934015918 | 0.48703055786596 | 68.850339776203 | low | ||
| Opportunity Occupations - Wages | median annual wages (bottom quartile)/MHI | number | 0.56926064227035 | 0.5527573256027 | 0.52033633762635 | 68.850339776203 | low | ||
| Opportunity Occupations - Diversity | relative to regional diversity | number | 1.4055624761785 | 2.0802233709678 | 0.024118967127234 | 68.850339776203 | low | ||
| Automation Risk | local automation index risk for frontline occupations | number | 106.85936764961 | 105.894645296 | 0.41299352375569 | 68.850339776203 | low | ||
| not directly part of a score | Nonwhite county population | percent | 0.027164685908319 | 0.093467743953257 | 0.021858600754093 | ||||
| Population | number | 97347 | 573818.40625 | 0.024254241285924 | |||||
| Labor force | number | 49997 | 319974.734375 | 0.022828263479456 | |||||
| Nonwhite regional population | percent | 0.10618834841076 | 0.093467743953257 | 0.39128940945528 | |||||
| combined_score | county | 79.408995340897 | low |
| category | applies_to | indicator | sub-text | data_type | raw_data | raw_data_state_average | normalized_data | category_score | simplified_category_score |
|---|---|---|---|---|---|---|---|---|---|
| individual | county | High School Graduation Rate | percent | 0.92335010358094 | 0.91158384662974 | 0.68107007271713 | 113.8440487689 | average | |
| Credentials held | % of CC participants completing training with occupational certification, certification, or license | percent | 0.0034013605442176 | 0.0060053600924168 | 0.18367346938775 | 113.8440487689 | average | ||
| Training Completion Rate | for Connecting Colorado (CC) participants | percent | 1 | 0.69235591265914 | 1 | 113.8440487689 | average | ||
| neighborhood | county | Bachelors Degree of higher | % of population | percent | 0.37160895728519 | 0.31919195744088 | 0.53022241125742 | 98.9777462741 | average |
| Cost of Living | indexed to national average | number | 106.4 | 111.7078125 | 0.85571142284569 | 98.9777462741 | average | ||
| Absenteeism | Chronically absent/student body | percent | 0.19751552795031 | 0.14699662849725 | 0.52117447769622 | 98.9777462741 | average | ||
| Crime | Criminal acts per 1,000 residents | number | 0.03010639100581 | 0.032152995153139 | 0.30196710178827 | 98.9777462741 | average | ||
| Unemployment rate | percent | 0.051238124902663 | 0.047095452067673 | 0.71934068415917 | 98.9777462741 | average | |||
| Labor force participation rate | percent | 0.57618449389806 | 0.61374589071264 | 0.54541733819651 | 98.9777462741 | average | |||
| industry | county | Target Industries - Diversity | relative to county diversity | number | 0.018796730312726 | 0.048480946595015 | 0.073796220059281 | 94.379681020588 | average |
| Target Industries - Employment Change, 1 Year | % change | percent | -0.12190723346933 | -0.054063603534816 | 0.60518632868892 | 94.379681020588 | average | ||
| Target Industries - Employment Change, 5 Years | % change | percent | -0.20603985885204 | -0.021846911546034 | 0.41223738669772 | 94.379681020588 | average | ||
| Related Industries - Diversity | relative to county diversity | number | 0.042591861047103 | 0.071509052995474 | 0.12722925343879 | 94.379681020588 | average | ||
| Related Industries - Employment Change, 1 Year | % change | percent | -0.25670702561283 | -0.02361410833971 | 0.47690312043851 | 94.379681020588 | average | ||
| Related Industries - Employment Change, 5 Years | % change | percent | 0.2645252101818 | -0.037060214673164 | 0.8693317069561 | 94.379681020588 | average | ||
| Target Industries - Employment | per 100,00 workers | number | 0.24731350256969 | 0.21299338245718 | 0.25274612134999 | 94.379681020588 | average | ||
| Target Industries - Income | average annual pay/MHI | number | 0.67699735243732 | 0.83593053070384 | 0.33931622495631 | 94.379681020588 | average | ||
| Related Industries - Employment | per 100,00 workers | number | 0.4480317624455 | 0.38864538870834 | 0.49382746410104 | 94.379681020588 | average | ||
| Related Industries - Income | average annual pay/MHI | number | 0.35814571288806 | 0.30736251703532 | 0.43331606602041 | 94.379681020588 | average | ||
| engagement | county | Decennial Census Participation | percent | 0.44 | 0.57375 | 0.39344262295082 | 48.205720597093 | low | |
| Management Diveristy | relative to regional diversity | number | 0.80841729998871 | 1.9021235388396 | 0.035877404563467 | 48.205720597093 | low | ||
| Sector Survey Partnerships | number | 0 | 0.40625 | 0 | 48.205720597093 | low | |||
| Completed Talent Gap Survey | number | 0.015333333333333 | 0.079886760824699 | 0.009423623722627 | 48.205720597093 | low | |||
| regional_context | region | Poverty | households living below the poverty line | percent | 0.055513514448656 | 0.083092833248716 | 0.82797331672802 | 112.16972196859 | average |
| Median Household Income | dollar | 52221 | 57007.9375 | 0.34671818448596 | 112.16972196859 | average | |||
| education_training | region | In-demand Occupations - Training Programs | programs per 100,000 residents | number | 0 | 4.4347320964544E-8 | 0 | 21.899181659034 | average |
| In-demand Occupations - Postsecondary Education Programs | programs per 100,000 residents | number | 0 | 7.6006736827312E-6 | 0 | 21.899181659034 | average | ||
| Opportunity Occupations - Training Programs | programs per 100,000 residents | number | 0 | 0.00014929954550687 | 0 | 21.899181659034 | average | ||
| Opportunity Occupations - Postsecondary Education Programs | programs per 100,000 residents | number | 0.00026708578589993 | 0.00038785139598413 | 0.1553919940465 | 21.899181659034 | average | ||
| regional_job_opportunities | region | In-demand Occupations - Program completers | per 100,00 workers | number | 0 | 0 | 68.850339776203 | low | |
| Opportunity Occupations - Program completers | per 100,00 workers | number | 0 | 0.0050575085821559 | 0 | 68.850339776203 | low | ||
| In-demand Occupations - Job Openings | per 100,00 workers | number | 0.00027977871060955 | 0.00027291351906945 | 0.36772211448099 | 68.850339776203 | low | ||
| In-demand Occupations - Wages | median annual wages (bottom quartile)/MHI | number | 0.60985040659505 | 0.58812061720987 | 0.53596115822454 | 68.850339776203 | low | ||
| In-demand Occupations - Diversity | relative to regional diversity | number | 2.0374089121924 | 3.0176038430139 | 0.039957970030868 | 68.850339776203 | low | ||
| Opportunity Occupations - Job Openings | per 100,00 workers | number | 0.00032058919811073 | 0.00030772934015918 | 0.48703055786596 | 68.850339776203 | low | ||
| Opportunity Occupations - Wages | median annual wages (bottom quartile)/MHI | number | 0.56926064227035 | 0.5527573256027 | 0.52033633762635 | 68.850339776203 | low | ||
| Opportunity Occupations - Diversity | relative to regional diversity | number | 1.4055624761785 | 2.0802233709678 | 0.024118967127234 | 68.850339776203 | low | ||
| Automation Risk | local automation index risk for frontline occupations | number | 106.85936764961 | 105.894645296 | 0.41299352375569 | 68.850339776203 | low | ||
| not directly part of a score | Nonwhite county population | percent | 0.15973741794311 | 0.093467743953257 | 0.52556103834593 | ||||
| Population | number | 97347 | 573818.40625 | 0.024254241285924 | |||||
| Labor force | number | 49997 | 319974.734375 | 0.022828263479456 | |||||
| Nonwhite regional population | percent | 0.10618834841076 | 0.093467743953257 | 0.39128940945528 | |||||
| combined_score | county | 79.760920009215 | low |
| category | applies_to | indicator | sub-text | data_type | raw_data | raw_data_state_average | normalized_data | category_score | simplified_category_score |
|---|---|---|---|---|---|---|---|---|---|
| individual | county | High School Graduation Rate | percent | 0.93741109530583 | 0.91158384662974 | 0.75245467807578 | 45.937945424146 | low | |
| Credentials held | % of CC participants completing training with occupational certification, certification, or license | percent | 0 | 0.0060053600924168 | 0 | 45.937945424146 | low | ||
| Training Completion Rate | for Connecting Colorado (CC) participants | percent | 0 | 0.69235591265914 | 0 | 45.937945424146 | low | ||
| neighborhood | county | Bachelors Degree of higher | % of population | percent | 0.45661450924609 | 0.31919195744088 | 0.69049785752513 | 76.143568952806 | low |
| Cost of Living | indexed to national average | number | 117.5 | 111.7078125 | 0.63326653306613 | 76.143568952806 | low | ||
| Absenteeism | Chronically absent/student body | percent | 0.4125 | 0.14699662849725 | 0 | 76.143568952806 | low | ||
| Crime | Criminal acts per 1,000 residents | number | 0.010501750291715 | 0.032152995153139 | 0.1053325554259 | 76.143568952806 | low | ||
| Unemployment rate | percent | 0.047146401985112 | 0.047095452067673 | 0.75032097819693 | 76.143568952806 | low | |||
| Labor force participation rate | percent | 0.55054644808743 | 0.61374589071264 | 0.49300174300887 | 76.143568952806 | low | |||
| industry | county | Target Industries - Diversity | relative to county diversity | number | 0 | 0.048480946595015 | 0 | 81.24958414794 | average |
| Target Industries - Employment Change, 1 Year | % change | percent | -0.15419253184975 | -0.054063603534816 | 0.58293512478177 | 81.24958414794 | average | ||
| Target Industries - Employment Change, 5 Years | % change | percent | -0.342411650031 | -0.021846911546034 | 0.34143087148196 | 81.24958414794 | average | ||
| Related Industries - Diversity | relative to county diversity | number | 0 | 0.071509052995474 | 0 | 81.24958414794 | average | ||
| Related Industries - Employment Change, 1 Year | % change | percent | -0.02361410833971 | 0.64160854047047 | 81.24958414794 | average | |||
| Related Industries - Employment Change, 5 Years | % change | percent | -0.037060214673164 | 0.68747676990253 | 81.24958414794 | average | |||
| Target Industries - Employment | per 100,00 workers | number | 0.18362282878412 | 0.21299338245718 | 0.18765638464653 | 81.24958414794 | average | ||
| Target Industries - Income | average annual pay/MHI | number | 0.67741935483871 | 0.83593053070384 | 0.33967600286193 | 81.24958414794 | average | ||
| Related Industries - Employment | per 100,00 workers | number | 0.38157108456546 | 0.38864538870834 | 0.42057348799721 | 81.24958414794 | average | ||
| Related Industries - Income | average annual pay/MHI | number | 0.28083565558494 | 0.30736251703532 | 0.31438213696002 | 81.24958414794 | average | ||
| engagement | county | Decennial Census Participation | percent | 0.2 | 0.57375 | 0 | 18.349553055412 | low | |
| Management Diveristy | relative to regional diversity | number | 1.3848026776209 | 1.9021235388396 | 0.16342107378641 | 18.349553055412 | low | ||
| Sector Survey Partnerships | number | 0 | 0.40625 | 0 | 18.349553055412 | low | |||
| Completed Talent Gap Survey | number | 0.16158536585366 | 0.079886760824699 | 0.11767915228106 | 18.349553055412 | low | |||
| regional_context | region | Poverty | households living below the poverty line | percent | 0.069232467274052 | 0.083092833248716 | 0.72830649938925 | 112.54667125801 | average |
| Median Household Income | dollar | 56458 | 57007.9375 | 0.45033258339039 | 112.54667125801 | average | |||
| education_training | region | In-demand Occupations - Training Programs | programs per 100,000 residents | number | 0 | 4.4347320964544E-8 | 0 | 24.736362724562 | average |
| In-demand Occupations - Postsecondary Education Programs | programs per 100,000 residents | number | 0 | 7.6006736827312E-6 | 0 | 24.736362724562 | average | ||
| Opportunity Occupations - Training Programs | programs per 100,000 residents | number | 0 | 0.00014929954550687 | 0 | 24.736362724562 | average | ||
| Opportunity Occupations - Postsecondary Education Programs | programs per 100,000 residents | number | 0.0003016884823123 | 0.00038785139598413 | 0.17552403505642 | 24.736362724562 | average | ||
| regional_job_opportunities | region | In-demand Occupations - Program completers | per 100,00 workers | number | 0 | 0 | 119.85406659605 | average | |
| Opportunity Occupations - Program completers | per 100,00 workers | number | 0 | 0.0050575085821559 | 0 | 119.85406659605 | average | ||
| In-demand Occupations - Job Openings | per 100,00 workers | number | 0.00030809722315893 | 0.00027291351906945 | 0.47546100629426 | 119.85406659605 | average | ||
| In-demand Occupations - Wages | median annual wages (bottom quartile)/MHI | number | 0.59141935348755 | 0.58812061720987 | 0.47218522837173 | 119.85406659605 | average | ||
| In-demand Occupations - Diversity | relative to regional diversity | number | 4.3910462204998 | 3.0176038430139 | 1 | 119.85406659605 | average | ||
| Opportunity Occupations - Job Openings | per 100,00 workers | number | 0.00033869894908574 | 0.00030772934015918 | 0.55039187703433 | 119.85406659605 | average | ||
| Opportunity Occupations - Wages | median annual wages (bottom quartile)/MHI | number | 0.53091970179337 | 0.5527573256027 | 0.39741621045704 | 119.85406659605 | average | ||
| Opportunity Occupations - Diversity | relative to regional diversity | number | 2.7544779661285 | 2.0802233709678 | 1 | 119.85406659605 | average | ||
| Automation Risk | local automation index risk for frontline occupations | number | 107.49706923391 | 105.894645296 | 0.26176508810736 | 119.85406659605 | average | ||
| not directly part of a score | Nonwhite county population | percent | 0.058343057176196 | 0.093467743953257 | 0.14031902143587 | ||||
| Population | number | 102755 | 573818.40625 | 0.025971041067006 | |||||
| Labor force | number | 48962 | 319974.734375 | 0.022251932795944 | |||||
| Nonwhite regional population | percent | 0.048639757702347 | 0.093467743953257 | 0 | |||||
| combined_score | county | 68.402536022704 | low |
| category | applies_to | indicator | sub-text | data_type | raw_data | raw_data_state_average | normalized_data | category_score | simplified_category_score |
|---|---|---|---|---|---|---|---|---|---|
| individual | county | High School Graduation Rate | percent | 0.97417503586801 | 0.91158384662974 | 0.93909723073539 | 57.332618947642 | low | |
| Credentials held | % of CC participants completing training with occupational certification, certification, or license | percent | 0 | 0.0060053600924168 | 0 | 57.332618947642 | low | ||
| Training Completion Rate | for Connecting Colorado (CC) participants | percent | 0 | 0.69235591265914 | 0 | 57.332618947642 | low | ||
| neighborhood | county | Bachelors Degree of higher | % of population | percent | 0.4648493543759 | 0.31919195744088 | 0.70602441370505 | 101.82918722343 | average |
| Cost of Living | indexed to national average | number | 127.3 | 111.7078125 | 0.43687374749499 | 101.82918722343 | average | ||
| Absenteeism | Chronically absent/student body | percent | 0.021052631578947 | 0.14699662849725 | 0.94896331738437 | 101.82918722343 | average | ||
| Crime | Criminal acts per 1,000 residents | number | 0.032152995153139 | 0 | 101.82918722343 | average | |||
| Unemployment rate | percent | 0.025641025641026 | 0.047095452067673 | 0.9131479574322 | 101.82918722343 | average | |||
| Labor force participation rate | percent | 0.58767123287671 | 0.61374589071264 | 0.56890135350634 | 101.82918722343 | average | |||
| industry | county | Target Industries - Diversity | relative to county diversity | number | 0.0018584243996226 | 0.048480946595015 | 0.0072961995877141 | 80.010900763323 | average |
| Target Industries - Employment Change, 1 Year | % change | percent | -0.21256944017154 | -0.054063603534816 | 0.54270144085443 | 80.010900763323 | average | ||
| Target Industries - Employment Change, 5 Years | % change | percent | -0.097706453359612 | -0.021846911546034 | 0.46848590303721 | 80.010900763323 | average | ||
| Related Industries - Diversity | relative to county diversity | number | 0 | 0.071509052995474 | 0 | 80.010900763323 | average | ||
| Related Industries - Employment Change, 1 Year | % change | percent | -0.02361410833971 | 0.64160854047047 | 80.010900763323 | average | |||
| Related Industries - Employment Change, 5 Years | % change | percent | -0.037060214673164 | 0.68747676990253 | 80.010900763323 | average | |||
| Target Industries - Employment | per 100,00 workers | number | 0 | 0.21299338245718 | 0 | 80.010900763323 | average | ||
| Target Industries - Income | average annual pay/MHI | number | 1.4405594405594 | 0.83593053070384 | 0.99029064588304 | 80.010900763323 | average | ||
| Related Industries - Employment | per 100,00 workers | number | 0 | 0.38864538870834 | 0 | 80.010900763323 | average | ||
| Related Industries - Income | average annual pay/MHI | number | 0.15726506721554 | 0.30736251703532 | 0.12428092498635 | 80.010900763323 | average | ||
| engagement | county | Decennial Census Participation | percent | 0.21 | 0.57375 | 0.016393442622951 | 1.8407194262097 | low | |
| Management Diveristy | relative to regional diversity | number | 0.6462829384499 | 1.9021235388396 | 0 | 1.8407194262097 | low | ||
| Sector Survey Partnerships | number | 1 | 0.40625 | 0.66666666666667 | 1.8407194262097 | low | |||
| Completed Talent Gap Survey | number | 0.17905405405405 | 0.079886760824699 | 0.1306094483034 | 1.8407194262097 | low | |||
| regional_context | region | Poverty | households living below the poverty line | percent | 0.1438553896891 | 0.083092833248716 | 0.18617844688537 | 17.777931143704 | low |
| Median Household Income | dollar | 38043 | 57007.9375 | 0 | 17.777931143704 | low | |||
| education_training | region | In-demand Occupations - Training Programs | programs per 100,000 residents | number | 0 | 4.4347320964544E-8 | 0 | 174.28698301625 | average |
| In-demand Occupations - Postsecondary Education Programs | programs per 100,000 residents | number | 0 | 7.6006736827312E-6 | 0 | 174.28698301625 | average | ||
| Opportunity Occupations - Training Programs | programs per 100,000 residents | number | 0.0004924948073917 | 0.00014929954550687 | 1 | 174.28698301625 | average | ||
| Opportunity Occupations - Postsecondary Education Programs | programs per 100,000 residents | number | 0.00040684353654097 | 0.00038785139598413 | 0.23670382980141 | 174.28698301625 | average | ||
| regional_job_opportunities | region | In-demand Occupations - Program completers | per 100,00 workers | number | 0 | 0 | 148.68886286218 | high | |
| Opportunity Occupations - Program completers | per 100,00 workers | number | 0.026701783687715 | 0.0050575085821559 | 1 | 148.68886286218 | high | ||
| In-demand Occupations - Job Openings | per 100,00 workers | number | 0.00028825560939433 | 0.00027291351906945 | 0.39997280842167 | 148.68886286218 | high | ||
| In-demand Occupations - Wages | median annual wages (bottom quartile)/MHI | number | 0.74395624490182 | 0.58812061720987 | 1 | 148.68886286218 | high | ||
| In-demand Occupations - Diversity | relative to regional diversity | number | 2.7713872310663 | 3.0176038430139 | 0.33934565933963 | 148.68886286218 | high | ||
| Opportunity Occupations - Job Openings | per 100,00 workers | number | 0.00030583096184998 | 0.00030772934015918 | 0.43539531896239 | 148.68886286218 | high | ||
| Opportunity Occupations - Wages | median annual wages (bottom quartile)/MHI | number | 0.71887613935415 | 0.5527573256027 | 1 | 148.68886286218 | high | ||
| Opportunity Occupations - Diversity | relative to regional diversity | number | 2.0562938908444 | 2.0802233709678 | 0.49489452704793 | 148.68886286218 | high | ||
| Automation Risk | local automation index risk for frontline occupations | number | 106.54406835124 | 105.894645296 | 0.48776551872559 | 148.68886286218 | high | ||
| not directly part of a score | Nonwhite county population | percent | 0.12621359223301 | 0.093467743953257 | 0.398189198991 | ||||
| Population | number | 46701 | 573818.40625 | 0.0081763859396384 | |||||
| Labor force | number | 20978 | 319974.734375 | 0.0066692875327701 | |||||
| Nonwhite regional population | percent | 0.11212228460125 | 0.093467743953257 | 0.43163594720953 | |||||
| combined_score | county | 83.109600483249 | low |
| category | applies_to | indicator | sub-text | data_type | raw_data | raw_data_state_average | normalized_data | category_score | simplified_category_score |
|---|---|---|---|---|---|---|---|---|---|
| individual | county | High School Graduation Rate | percent | 0.93532178058365 | 0.91158384662974 | 0.74184768037383 | 106.73035699865 | average | |
| Credentials held | % of CC participants completing training with occupational certification, certification, or license | percent | 0.0054090601757944 | 0.0060053600924168 | 0.2920892494929 | 106.73035699865 | average | ||
| Training Completion Rate | for Connecting Colorado (CC) participants | percent | 0.71428571428571 | 0.69235591265914 | 0.71428571428571 | 106.73035699865 | average | ||
| neighborhood | county | Bachelors Degree of higher | % of population | percent | 0.33782129742962 | 0.31919195744088 | 0.46651678101594 | 96.741784770998 | average |
| Cost of Living | indexed to national average | number | 109.5 | 111.7078125 | 0.7935871743487 | 96.741784770998 | average | ||
| Absenteeism | Chronically absent/student body | percent | 0.14870954526833 | 0.14699662849725 | 0.63949201147071 | 96.741784770998 | average | ||
| Crime | Criminal acts per 1,000 residents | number | 0.023214194406095 | 0.032152995153139 | 0.23283836989313 | 96.741784770998 | average | ||
| Unemployment rate | percent | 0.033622183708839 | 0.047095452067673 | 0.85271898198957 | 96.741784770998 | average | |||
| Labor force participation rate | percent | 0.51004773410337 | 0.61374589071264 | 0.41020431712516 | 96.741784770998 | average | |||
| industry | county | Target Industries - Diversity | relative to county diversity | number | 0.018741323579158 | 0.048480946595015 | 0.073578692466177 | 107.2183964315 | average |
| Target Industries - Employment Change, 1 Year | % change | percent | 0.062897093242721 | -0.054063603534816 | 0.73255447960831 | 107.2183964315 | average | ||
| Target Industries - Employment Change, 5 Years | % change | percent | 0.18454305932006 | -0.021846911546034 | 0.61503457150757 | 107.2183964315 | average | ||
| Related Industries - Diversity | relative to county diversity | number | 0 | 0.071509052995474 | 0 | 107.2183964315 | average | ||
| Related Industries - Employment Change, 1 Year | % change | percent | 0.021942406307442 | -0.02361410833971 | 0.6556869757558 | 107.2183964315 | average | ||
| Related Industries - Employment Change, 5 Years | % change | percent | 0.013625690275796 | -0.037060214673164 | 0.69684411544103 | 107.2183964315 | average | ||
| Target Industries - Employment | per 100,00 workers | number | 0.38705950317735 | 0.21299338245718 | 0.39556185628062 | 107.2183964315 | average | ||
| Target Industries - Income | average annual pay/MHI | number | 0.97250144425188 | 0.83593053070384 | 0.59124806919384 | 107.2183964315 | average | ||
| Related Industries - Employment | per 100,00 workers | number | 0.45630644361167 | 0.38864538870834 | 0.50294794429698 | 107.2183964315 | average | ||
| Related Industries - Income | average annual pay/MHI | number | 0.32087285506805 | 0.30736251703532 | 0.3759754355451 | 107.2183964315 | average | ||
| engagement | county | Decennial Census Participation | percent | 0.62 | 0.57375 | 0.68852459016393 | 104.48891606937 | average | |
| Management Diveristy | relative to regional diversity | number | 1.7401519007555 | 1.9021235388396 | 0.24205343597486 | 104.48891606937 | average | ||
| Sector Survey Partnerships | number | 1 | 0.40625 | 0.66666666666667 | 104.48891606937 | average | |||
| Completed Talent Gap Survey | number | 0.020637898686679 | 0.079886760824699 | 0.013350054803299 | 104.48891606937 | average | |||
| regional_context | region | Poverty | households living below the poverty line | percent | 0.084434611085284 | 0.083092833248716 | 0.61786444818643 | 91.221687670605 | average |
| Median Household Income | dollar | 51842 | 57007.9375 | 0.33744986794483 | 91.221687670605 | average | |||
| education_training | region | In-demand Occupations - Training Programs | programs per 100,000 residents | number | 0 | 4.4347320964544E-8 | 0 | 0 | low |
| In-demand Occupations - Postsecondary Education Programs | programs per 100,000 residents | number | 0 | 7.6006736827312E-6 | 0 | 0 | low | ||
| Opportunity Occupations - Training Programs | programs per 100,000 residents | number | 0 | 0.00014929954550687 | 0 | 0 | low | ||
| Opportunity Occupations - Postsecondary Education Programs | programs per 100,000 residents | number | 0 | 0.00038785139598413 | 0 | 0 | low | ||
| regional_job_opportunities | region | In-demand Occupations - Program completers | per 100,00 workers | number | 0 | 0 | 73.719074202173 | average | |
| Opportunity Occupations - Program completers | per 100,00 workers | number | 0 | 0.0050575085821559 | 0 | 73.719074202173 | average | ||
| In-demand Occupations - Job Openings | per 100,00 workers | number | 0.00028628813613513 | 0.00027291351906945 | 0.39248747923114 | 73.719074202173 | average | ||
| In-demand Occupations - Wages | median annual wages (bottom quartile)/MHI | number | 0.63633644482273 | 0.58812061720987 | 0.62760929716894 | 73.719074202173 | average | ||
| In-demand Occupations - Diversity | relative to regional diversity | number | 1.9394480249676 | 3.0176038430139 | 0 | 73.719074202173 | average | ||
| Opportunity Occupations - Job Openings | per 100,00 workers | number | 0.00033258602588992 | 0.00030772934015918 | 0.52900434508004 | 73.719074202173 | average | ||
| Opportunity Occupations - Wages | median annual wages (bottom quartile)/MHI | number | 0.57687190890398 | 0.5527573256027 | 0.54473787423149 | 73.719074202173 | average | ||
| Opportunity Occupations - Diversity | relative to regional diversity | number | 1.3722239366808 | 2.0802233709678 | 0 | 73.719074202173 | average | ||
| Automation Risk | local automation index risk for frontline occupations | number | 106.64783787638 | 105.894645296 | 0.4631569818459 | 73.719074202173 | average | ||
| not directly part of a score | Nonwhite county population | percent | 0.063046479521399 | 0.093467743953257 | 0.15818940295354 | ||||
| Population | number | 79405 | 573818.40625 | 0.018558453254824 | |||||
| Labor force | number | 30110 | 319974.734375 | 0.011754361737434 | |||||
| Nonwhite regional population | percent | 0.095418434279457 | 0.093467743953257 | 0.31806166767315 | |||||
| combined_score | county | 82.8743165919 | low |
| category | applies_to | indicator | sub-text | data_type | raw_data | raw_data_state_average | normalized_data | category_score | simplified_category_score |
|---|---|---|---|---|---|---|---|---|---|
| individual | county | High School Graduation Rate | percent | 0.97688882606545 | 0.91158384662974 | 0.9528745549854 | 102.3245498257 | average | |
| Credentials held | % of CC participants completing training with occupational certification, certification, or license | percent | 0.0018181818181818 | 0.0060053600924168 | 0.098181818181817 | 102.3245498257 | average | ||
| Training Completion Rate | for Connecting Colorado (CC) participants | percent | 0.625 | 0.69235591265914 | 0.625 | 102.3245498257 | average | ||
| neighborhood | county | Bachelors Degree of higher | % of population | percent | 0.2979715880981 | 0.31919195744088 | 0.39138133633714 | 94.816032776345 | average |
| Cost of Living | indexed to national average | number | 107.6 | 111.7078125 | 0.83166332665331 | 94.816032776345 | average | ||
| Absenteeism | Chronically absent/student body | percent | 0.14347826086957 | 0.14699662849725 | 0.65217391304348 | 94.816032776345 | average | ||
| Crime | Criminal acts per 1,000 residents | number | 0.014495998208989 | 0.032152995153139 | 0.14539486203616 | 94.816032776345 | average | ||
| Unemployment rate | percent | 0.05511811023622 | 0.047095452067673 | 0.68996355161184 | 94.816032776345 | average | |||
| Labor force participation rate | percent | 0.61129179133602 | 0.61374589071264 | 0.61719230514337 | 94.816032776345 | average | |||
| industry | county | Target Industries - Diversity | relative to county diversity | number | 0.0013672902067641 | 0.048480946595015 | 0.0053680000353545 | 75.133804609629 | average |
| Target Industries - Employment Change, 1 Year | % change | percent | -0.038894082167055 | -0.054063603534816 | 0.66239944578134 | 75.133804609629 | average | ||
| Target Industries - Employment Change, 5 Years | % change | percent | 0.060733337442486 | -0.021846911546034 | 0.55075049281215 | 75.133804609629 | average | ||
| Related Industries - Diversity | relative to county diversity | number | 0 | 0.071509052995474 | 0 | 75.133804609629 | average | ||
| Related Industries - Employment Change, 1 Year | % change | percent | -0.29936219269483 | -0.02361410833971 | 0.4495352009435 | 75.133804609629 | average | ||
| Related Industries - Employment Change, 5 Years | % change | percent | 0.11047872717635 | -0.037060214673164 | 0.76342832840467 | 75.133804609629 | average | ||
| Target Industries - Employment | per 100,00 workers | number | 0.071185358586933 | 0.21299338245718 | 0.072749053702337 | 75.133804609629 | average | ||
| Target Industries - Income | average annual pay/MHI | number | 0.27899553096403 | 0.83593053070384 | 0 | 75.133804609629 | average | ||
| Related Industries - Employment | per 100,00 workers | number | 0.32109061602963 | 0.38864538870834 | 0.35391099013843 | 75.133804609629 | average | ||
| Related Industries - Income | average annual pay/MHI | number | 0.33191505256581 | 0.30736251703532 | 0.39296277172984 | 75.133804609629 | average | ||
| engagement | county | Decennial Census Participation | percent | 0.41 | 0.57375 | 0.34426229508197 | 68.077880998997 | average | |
| Management Diveristy | relative to regional diversity | number | 1.8304697473557 | 1.9021235388396 | 0.26203914345242 | 68.077880998997 | average | ||
| Sector Survey Partnerships | number | 1 | 0.40625 | 0.66666666666667 | 68.077880998997 | average | |||
| Completed Talent Gap Survey | number | 0.18661971830986 | 0.079886760824699 | 0.13620954129899 | 68.077880998997 | average | |||
| regional_context | region | Poverty | households living below the poverty line | percent | 0.054927945498386 | 0.083092833248716 | 0.83222741646497 | 151.24123659018 | average |
| Median Household Income | dollar | 68779 | 57007.9375 | 0.75163846229091 | 151.24123659018 | average | |||
| education_training | region | In-demand Occupations - Training Programs | programs per 100,000 residents | number | 0 | 4.4347320964544E-8 | 0 | 65.15477048933 | average |
| In-demand Occupations - Postsecondary Education Programs | programs per 100,000 residents | number | 4.0465897364996E-6 | 7.6006736827312E-6 | 0.028251940676994 | 65.15477048933 | average | ||
| Opportunity Occupations - Training Programs | programs per 100,000 residents | number | 0.00011869996560399 | 0.00014929954550687 | 0.24101769972486 | 65.15477048933 | average | ||
| Opportunity Occupations - Postsecondary Education Programs | programs per 100,000 residents | number | 0.00033182035839296 | 0.00038785139598413 | 0.19305492795946 | 65.15477048933 | average | ||
| regional_job_opportunities | region | In-demand Occupations - Program completers | per 100,00 workers | number | 0 | 0 | 59.417203768588 | low | |
| Opportunity Occupations - Program completers | per 100,00 workers | number | 0.0098669346408314 | 0.0050575085821559 | 0.36952342795627 | 59.417203768588 | low | ||
| In-demand Occupations - Job Openings | per 100,00 workers | number | 0.00018312518894847 | 0.00027291351906945 | 0 | 59.417203768588 | low | ||
| In-demand Occupations - Wages | median annual wages (bottom quartile)/MHI | number | 0.4869230433708 | 0.58812061720987 | 0.11060256106486 | 59.417203768588 | low | ||
| In-demand Occupations - Diversity | relative to regional diversity | number | 2.1594588985097 | 3.0176038430139 | 0.089741815744161 | 59.417203768588 | low | ||
| Opportunity Occupations - Job Openings | per 100,00 workers | number | 0.00024783283115299 | 0.00030772934015918 | 0.23247491020963 | 59.417203768588 | low | ||
| Opportunity Occupations - Wages | median annual wages (bottom quartile)/MHI | number | 0.47519998473517 | 0.5527573256027 | 0.21878014620234 | 59.417203768588 | low | ||
| Opportunity Occupations - Diversity | relative to regional diversity | number | 1.7791864980049 | 2.0802233709678 | 0.29441951526575 | 59.417203768588 | low | ||
| Automation Risk | local automation index risk for frontline occupations | number | 105.45774206801 | 105.894645296 | 0.7453835464373 | 59.417203768588 | low | ||
| not directly part of a score | Nonwhite county population | percent | 0.056584765209604 | 0.093467743953257 | 0.1336384926727 | ||||
| Population | number | 741365 | 573818.40625 | 0.22870134953542 | |||||
| Labor force | number | 393891 | 319974.734375 | 0.21432262490506 | |||||
| Nonwhite regional population | percent | 0.10467194532876 | 0.093467743953257 | 0.38097894904001 | |||||
| combined_score | county | 88.02363986554 | average |
| category | applies_to | indicator | sub-text | data_type | raw_data | raw_data_state_average | normalized_data | category_score | simplified_category_score |
|---|---|---|---|---|---|---|---|---|---|
| individual | county | High School Graduation Rate | percent | 0.98125667713973 | 0.91158384662974 | 0.9750491875649 | 120.94243995439 | average | |
| Credentials held | % of CC participants completing training with occupational certification, certification, or license | percent | 0.0047868497109826 | 0.0060053600924168 | 0.25848988439306 | 120.94243995439 | average | ||
| Training Completion Rate | for Connecting Colorado (CC) participants | percent | 0.74747474747475 | 0.69235591265914 | 0.74747474747475 | 120.94243995439 | average | ||
| neighborhood | county | Bachelors Degree of higher | % of population | percent | 0.5801730083529 | 0.31919195744088 | 0.92346374184318 | 128.73229759493 | high |
| Cost of Living | indexed to national average | number | 115.4 | 111.7078125 | 0.6753507014028 | 128.73229759493 | high | ||
| Absenteeism | Chronically absent/student body | percent | 0.15330516148506 | 0.14699662849725 | 0.62835112367258 | 128.73229759493 | high | ||
| Crime | Criminal acts per 1,000 residents | number | 0.054061855547405 | 0.032152995153139 | 0.54224041114047 | 128.73229759493 | high | ||
| Unemployment rate | percent | 0.028830418057002 | 0.047095452067673 | 0.88899961776215 | 128.73229759493 | high | |||
| Labor force participation rate | percent | 0.72992270430226 | 0.61374589071264 | 0.85972677741583 | 128.73229759493 | high | |||
| industry | county | Target Industries - Diversity | relative to county diversity | number | 0.13973550544069 | 0.048480946595015 | 0.54860350380269 | 120.45159029865 | average |
| Target Industries - Employment Change, 1 Year | % change | percent | 0.093503738091538 | -0.054063603534816 | 0.75364874633678 | 120.45159029865 | average | ||
| Target Industries - Employment Change, 5 Years | % change | percent | 0.10537553316763 | -0.021846911546034 | 0.57392946761002 | 120.45159029865 | average | ||
| Related Industries - Diversity | relative to county diversity | number | 0.20770415524317 | 0.071509052995474 | 0.62044822550716 | 120.45159029865 | average | ||
| Related Industries - Employment Change, 1 Year | % change | percent | 0.088955281474771 | -0.02361410833971 | 0.69868300878464 | 120.45159029865 | average | ||
| Related Industries - Employment Change, 5 Years | % change | percent | 0.22615143968621 | -0.037060214673164 | 0.84295063116682 | 120.45159029865 | average | ||
| Target Industries - Employment | per 100,00 workers | number | 0.18891203162526 | 0.21299338245718 | 0.19306177290573 | 120.45159029865 | average | ||
| Target Industries - Income | average annual pay/MHI | number | 0.73683343605874 | 0.83593053070384 | 0.39032944377887 | 120.45159029865 | average | ||
| Related Industries - Employment | per 100,00 workers | number | 0.16393134552744 | 0.38864538870834 | 0.18068763742689 | 120.45159029865 | average | ||
| Related Industries - Income | average annual pay/MHI | number | 0.34279556538443 | 0.30736251703532 | 0.40970137191787 | 120.45159029865 | average | ||
| engagement | county | Decennial Census Participation | percent | 0.8 | 0.57375 | 0.98360655737705 | 132.68703292824 | average | |
| Management Diveristy | relative to regional diversity | number | 1.5415382652715 | 1.9021235388396 | 0.19810382724015 | 132.68703292824 | average | ||
| Sector Survey Partnerships | number | 1 | 0.40625 | 0.66666666666667 | 132.68703292824 | average | |||
| Completed Talent Gap Survey | number | 0.019223224794037 | 0.079886760824699 | 0.012302915373188 | 132.68703292824 | average | |||
| regional_context | region | Poverty | households living below the poverty line | percent | 0.047454786961363 | 0.083092833248716 | 0.88651916426326 | 176.71787494652 | high |
| Median Household Income | dollar | 77469 | 57007.9375 | 0.96414946688839 | 176.71787494652 | high | |||
| education_training | region | In-demand Occupations - Training Programs | programs per 100,000 residents | number | 3.1535872685898E-7 | 4.4347320964544E-8 | 1 | 193.44445969274 | high |
| In-demand Occupations - Postsecondary Education Programs | programs per 100,000 residents | number | 6.9378919908975E-6 | 7.6006736827312E-6 | 0.048438049249783 | 193.44445969274 | high | ||
| Opportunity Occupations - Training Programs | programs per 100,000 residents | number | 6.3071745371795E-5 | 0.00014929954550687 | 0.12806580785253 | 193.44445969274 | high | ||
| Opportunity Occupations - Postsecondary Education Programs | programs per 100,000 residents | number | 0.00033711847901225 | 0.00038785139598413 | 0.19613740396976 | 193.44445969274 | high | ||
| regional_job_opportunities | region | In-demand Occupations - Program completers | per 100,00 workers | number | 0 | 0 | 66.151339958307 | low | |
| Opportunity Occupations - Program completers | per 100,00 workers | number | 0.003170931998567 | 0.0050575085821559 | 0.1187535647675 | 66.151339958307 | low | ||
| In-demand Occupations - Job Openings | per 100,00 workers | number | 0.00020973237709418 | 0.00027291351906945 | 0.10122809099128 | 66.151339958307 | low | ||
| In-demand Occupations - Wages | median annual wages (bottom quartile)/MHI | number | 0.4549592338032 | 0.58812061720987 | 0 | 66.151339958307 | low | ||
| In-demand Occupations - Diversity | relative to regional diversity | number | 2.5847822502142 | 3.0176038430139 | 0.26323001314928 | 66.151339958307 | low | ||
| Opportunity Occupations - Job Openings | per 100,00 workers | number | 0.00029180424952505 | 0.00030772934015918 | 0.38631949247925 | 66.151339958307 | low | ||
| Opportunity Occupations - Wages | median annual wages (bottom quartile)/MHI | number | 0.45354968003976 | 0.5527573256027 | 0.14936979337045 | 66.151339958307 | low | ||
| Opportunity Occupations - Diversity | relative to regional diversity | number | 1.875531883512 | 2.0802233709678 | 0.36412116449562 | 66.151339958307 | low | ||
| Automation Risk | local automation index risk for frontline occupations | number | 104.75733697161 | 105.894645296 | 0.91148187464576 | 66.151339958307 | low | ||
| not directly part of a score | Nonwhite county population | percent | 0.11122452319806 | 0.093467743953257 | 0.34123909700355 | ||||
| Population | number | 3170992 | 573818.40625 | 1 | |||||
| Labor force | number | 1804845 | 319974.734375 | 1 | |||||
| Nonwhite regional population | percent | 0.14380095465729 | 0.093467743953257 | 0.64702833034125 | |||||
| combined_score | county | 134.1610050534 | high |
| category | applies_to | indicator | sub-text | data_type | raw_data | raw_data_state_average | normalized_data | category_score | simplified_category_score |
|---|---|---|---|---|---|---|---|---|---|
| individual | county | High School Graduation Rate | percent | 0.97213176018365 | 0.91158384662974 | 0.9287239632433 | 102.57793309451 | average | |
| Credentials held | % of CC participants completing training with occupational certification, certification, or license | percent | 0.0038153376573826 | 0.0060053600924168 | 0.20602823349866 | 102.57793309451 | average | ||
| Training Completion Rate | for Connecting Colorado (CC) participants | percent | 0.54545454545455 | 0.69235591265914 | 0.54545454545455 | 102.57793309451 | average | ||
| neighborhood | county | Bachelors Degree of higher | % of population | percent | 0.37702204900966 | 0.31919195744088 | 0.54042863510767 | 105.82294650592 | average |
| Cost of Living | indexed to national average | number | 108.6 | 111.7078125 | 0.81162324649299 | 105.82294650592 | average | ||
| Absenteeism | Chronically absent/student body | percent | 0.077761627906977 | 0.14699662849725 | 0.81148696264975 | 105.82294650592 | average | ||
| Crime | Criminal acts per 1,000 residents | number | 0.025159027891046 | 0.032152995153139 | 0.25234504974719 | 105.82294650592 | average | ||
| Unemployment rate | percent | 0.057273587882613 | 0.047095452067673 | 0.67364345061218 | 105.82294650592 | average | |||
| Labor force participation rate | percent | 0.61489206888188 | 0.61374589071264 | 0.62455287746627 | 105.82294650592 | average | |||
| industry | county | Target Industries - Diversity | relative to county diversity | number | 0.022942658414943 | 0.048480946595015 | 0.090073190441412 | 96.243088245152 | average |
| Target Industries - Employment Change, 1 Year | % change | percent | -0.0066821534132694 | -0.054063603534816 | 0.68460008294126 | 96.243088245152 | average | ||
| Target Industries - Employment Change, 5 Years | % change | percent | 0.26458065780218 | -0.021846911546034 | 0.65659143151332 | 96.243088245152 | average | ||
| Related Industries - Diversity | relative to county diversity | number | 0 | 0.071509052995474 | 0 | 96.243088245152 | average | ||
| Related Industries - Employment Change, 1 Year | % change | percent | -0.042103793142827 | -0.02361410833971 | 0.61459438720383 | 96.243088245152 | average | ||
| Related Industries - Employment Change, 5 Years | % change | percent | 0.022387945745596 | -0.037060214673164 | 0.70286796252847 | 96.243088245152 | average | ||
| Target Industries - Employment | per 100,00 workers | number | 0.25591669296308 | 0.21299338245718 | 0.26153829395913 | 96.243088245152 | average | ||
| Target Industries - Income | average annual pay/MHI | number | 0.59932155254023 | 0.83593053070384 | 0.27309376623998 | 96.243088245152 | average | ||
| Related Industries - Employment | per 100,00 workers | number | 0.5377260031235 | 0.38864538870834 | 0.59268982862787 | 96.243088245152 | average | ||
| Related Industries - Income | average annual pay/MHI | number | 0.26399352989634 | 0.30736251703532 | 0.28847218097564 | 96.243088245152 | average | ||
| engagement | county | Decennial Census Participation | percent | 0.57 | 0.57375 | 0.60655737704918 | 101.33985623665 | average | |
| Management Diveristy | relative to regional diversity | number | 1.9838306046922 | 1.9021235388396 | 0.2959751300665 | 101.33985623665 | average | ||
| Sector Survey Partnerships | number | 1.5 | 0.40625 | 1 | 101.33985623665 | average | |||
| Completed Talent Gap Survey | number | 0.11312700106724 | 0.079886760824699 | 0.08181034551899 | 101.33985623665 | average | |||
| regional_context | region | Poverty | households living below the poverty line | percent | 0.054927945498386 | 0.083092833248716 | 0.83222741646497 | 151.24123659018 | average |
| Median Household Income | dollar | 68779 | 57007.9375 | 0.75163846229091 | 151.24123659018 | average | |||
| education_training | region | In-demand Occupations - Training Programs | programs per 100,000 residents | number | 0 | 4.4347320964544E-8 | 0 | 65.15477048933 | average |
| In-demand Occupations - Postsecondary Education Programs | programs per 100,000 residents | number | 4.0465897364996E-6 | 7.6006736827312E-6 | 0.028251940676994 | 65.15477048933 | average | ||
| Opportunity Occupations - Training Programs | programs per 100,000 residents | number | 0.00011869996560399 | 0.00014929954550687 | 0.24101769972486 | 65.15477048933 | average | ||
| Opportunity Occupations - Postsecondary Education Programs | programs per 100,000 residents | number | 0.00033182035839296 | 0.00038785139598413 | 0.19305492795946 | 65.15477048933 | average | ||
| regional_job_opportunities | region | In-demand Occupations - Program completers | per 100,00 workers | number | 0 | 0 | 59.417203768588 | low | |
| Opportunity Occupations - Program completers | per 100,00 workers | number | 0.0098669346408314 | 0.0050575085821559 | 0.36952342795627 | 59.417203768588 | low | ||
| In-demand Occupations - Job Openings | per 100,00 workers | number | 0.00018312518894847 | 0.00027291351906945 | 0 | 59.417203768588 | low | ||
| In-demand Occupations - Wages | median annual wages (bottom quartile)/MHI | number | 0.4869230433708 | 0.58812061720987 | 0.11060256106486 | 59.417203768588 | low | ||
| In-demand Occupations - Diversity | relative to regional diversity | number | 2.1594588985097 | 3.0176038430139 | 0.089741815744161 | 59.417203768588 | low | ||
| Opportunity Occupations - Job Openings | per 100,00 workers | number | 0.00024783283115299 | 0.00030772934015918 | 0.23247491020963 | 59.417203768588 | low | ||
| Opportunity Occupations - Wages | median annual wages (bottom quartile)/MHI | number | 0.47519998473517 | 0.5527573256027 | 0.21878014620234 | 59.417203768588 | low | ||
| Opportunity Occupations - Diversity | relative to regional diversity | number | 1.7791864980049 | 2.0802233709678 | 0.29441951526575 | 59.417203768588 | low | ||
| Automation Risk | local automation index risk for frontline occupations | number | 105.45774206801 | 105.894645296 | 0.7453835464373 | 59.417203768588 | low | ||
| not directly part of a score | Nonwhite county population | percent | 0.053131626162127 | 0.093467743953257 | 0.12051849032484 | ||||
| Population | number | 741365 | 573818.40625 | 0.22870134953542 | |||||
| Labor force | number | 393891 | 319974.734375 | 0.21432262490506 | |||||
| Nonwhite regional population | percent | 0.10467194532876 | 0.093467743953257 | 0.38097894904001 | |||||
| combined_score | county | 97.399576418618 | average |
| category | applies_to | indicator | sub-text | data_type | raw_data | raw_data_state_average | normalized_data | category_score | simplified_category_score |
|---|---|---|---|---|---|---|---|---|---|
| individual | county | High School Graduation Rate | percent | 0.90070921985816 | 0.91158384662974 | 0.56612721654143 | 140.80932999823 | high | |
| Credentials held | % of CC participants completing training with occupational certification, certification, or license | percent | 0.016865869853918 | 0.0060053600924168 | 0.91075697211155 | 140.80932999823 | high | ||
| Training Completion Rate | for Connecting Colorado (CC) participants | percent | 0.82954545454545 | 0.69235591265914 | 0.82954545454545 | 140.80932999823 | high | ||
| neighborhood | county | Bachelors Degree of higher | % of population | percent | 0.18461371880245 | 0.31919195744088 | 0.17764843689458 | 86.569675422629 | average |
| Cost of Living | indexed to national average | number | 101.9 | 111.7078125 | 0.94589178356713 | 86.569675422629 | average | ||
| Absenteeism | Chronically absent/student body | percent | 0.1422893481717 | 0.14699662849725 | 0.65505612564436 | 86.569675422629 | average | ||
| Crime | Criminal acts per 1,000 residents | number | 0.043701527862894 | 0.032152995153139 | 0.43832632446483 | 86.569675422629 | average | ||
| Unemployment rate | percent | 0.054835099730103 | 0.047095452067673 | 0.69210635279168 | 86.569675422629 | average | |||
| Labor force participation rate | percent | 0.37265724659013 | 0.61374589071264 | 0.1293169113799 | 86.569675422629 | average | |||
| industry | county | Target Industries - Diversity | relative to county diversity | number | 0.033374571321783 | 0.048480946595015 | 0.13102902306253 | 93.827891332362 | average |
| Target Industries - Employment Change, 1 Year | % change | percent | -0.093947890035789 | -0.054063603534816 | 0.6244560608289 | 93.827891332362 | average | ||
| Target Industries - Employment Change, 5 Years | % change | percent | 0.038096669168903 | -0.021846911546034 | 0.53899715597694 | 93.827891332362 | average | ||
| Related Industries - Diversity | relative to county diversity | number | 0.037458401372793 | 0.071509052995474 | 0.11189472177326 | 93.827891332362 | average | ||
| Related Industries - Employment Change, 1 Year | % change | percent | 0.01231768947122 | -0.02361410833971 | 0.64951167523407 | 93.827891332362 | average | ||
| Related Industries - Employment Change, 5 Years | % change | percent | -0.2308145939019 | -0.037060214673164 | 0.52879709844049 | 93.827891332362 | average | ||
| Target Industries - Employment | per 100,00 workers | number | 0.21065104338095 | 0.21299338245718 | 0.21527831525438 | 93.827891332362 | average | ||
| Target Industries - Income | average annual pay/MHI | number | 0.94095187940228 | 0.83593053070384 | 0.56435050575015 | 93.827891332362 | average | ||
| Related Industries - Employment | per 100,00 workers | number | 0.32633224716145 | 0.38864538870834 | 0.35968839617645 | 93.827891332362 | average | ||
| Related Industries - Income | average annual pay/MHI | number | 0.29489465481997 | 0.30736251703532 | 0.33601052627971 | 93.827891332362 | average | ||
| engagement | county | Decennial Census Participation | percent | 0.7 | 0.57375 | 0.81967213114754 | 109.46160136591 | average | |
| Management Diveristy | relative to regional diversity | number | 1.3476172829194 | 1.9021235388396 | 0.15519261785086 | 109.46160136591 | average | ||
| Sector Survey Partnerships | number | 1 | 0.40625 | 0.66666666666667 | 109.46160136591 | average | |||
| Completed Talent Gap Survey | number | 0.023255813953488 | 0.079886760824699 | 0.01528783163994 | 109.46160136591 | average | |||
| regional_context | region | Poverty | households living below the poverty line | percent | 0.084434611085284 | 0.083092833248716 | 0.61786444818643 | 91.221687670605 | average |
| Median Household Income | dollar | 51842 | 57007.9375 | 0.33744986794483 | 91.221687670605 | average | |||
| education_training | region | In-demand Occupations - Training Programs | programs per 100,000 residents | number | 0 | 4.4347320964544E-8 | 0 | 0 | low |
| In-demand Occupations - Postsecondary Education Programs | programs per 100,000 residents | number | 0 | 7.6006736827312E-6 | 0 | 0 | low | ||
| Opportunity Occupations - Training Programs | programs per 100,000 residents | number | 0 | 0.00014929954550687 | 0 | 0 | low | ||
| Opportunity Occupations - Postsecondary Education Programs | programs per 100,000 residents | number | 0 | 0.00038785139598413 | 0 | 0 | low | ||
| regional_job_opportunities | region | In-demand Occupations - Program completers | per 100,00 workers | number | 0 | 0 | 73.719074202173 | average | |
| Opportunity Occupations - Program completers | per 100,00 workers | number | 0 | 0.0050575085821559 | 0 | 73.719074202173 | average | ||
| In-demand Occupations - Job Openings | per 100,00 workers | number | 0.00028628813613513 | 0.00027291351906945 | 0.39248747923114 | 73.719074202173 | average | ||
| In-demand Occupations - Wages | median annual wages (bottom quartile)/MHI | number | 0.63633644482273 | 0.58812061720987 | 0.62760929716894 | 73.719074202173 | average | ||
| In-demand Occupations - Diversity | relative to regional diversity | number | 1.9394480249676 | 3.0176038430139 | 0 | 73.719074202173 | average | ||
| Opportunity Occupations - Job Openings | per 100,00 workers | number | 0.00033258602588992 | 0.00030772934015918 | 0.52900434508004 | 73.719074202173 | average | ||
| Opportunity Occupations - Wages | median annual wages (bottom quartile)/MHI | number | 0.57687190890398 | 0.5527573256027 | 0.54473787423149 | 73.719074202173 | average | ||
| Opportunity Occupations - Diversity | relative to regional diversity | number | 1.3722239366808 | 2.0802233709678 | 0 | 73.719074202173 | average | ||
| Automation Risk | local automation index risk for frontline occupations | number | 106.64783787638 | 105.894645296 | 0.4631569818459 | 73.719074202173 | average | ||
| not directly part of a score | Nonwhite county population | percent | 0.10179412945627 | 0.093467743953257 | 0.3054088607077 | ||||
| Population | number | 79405 | 573818.40625 | 0.018558453254824 | |||||
| Labor force | number | 30110 | 319974.734375 | 0.011754361737434 | |||||
| Nonwhite regional population | percent | 0.095418434279457 | 0.093467743953257 | 0.31806166767315 | |||||
| combined_score | county | 85.087037141701 | average |
| category | applies_to | indicator | sub-text | data_type | raw_data | raw_data_state_average | normalized_data | category_score | simplified_category_score |
|---|---|---|---|---|---|---|---|---|---|
| individual | county | High School Graduation Rate | percent | 0.8306067508801 | 0.91158384662974 | 0.21023218576585 | 83.508192944352 | average | |
| Credentials held | % of CC participants completing training with occupational certification, certification, or license | percent | 0.0066225165562913 | 0.0060053600924168 | 0.35761589403973 | 83.508192944352 | average | ||
| Training Completion Rate | for Connecting Colorado (CC) participants | percent | 0.8 | 0.69235591265914 | 0.8 | 83.508192944352 | average | ||
| neighborhood | county | Bachelors Degree of higher | % of population | percent | 0.22095671981777 | 0.31919195744088 | 0.24617208708061 | 87.705801600272 | average |
| Cost of Living | indexed to national average | number | 104.1 | 111.7078125 | 0.90180360721443 | 87.705801600272 | average | ||
| Absenteeism | Chronically absent/student body | percent | 0.11711711711712 | 0.14699662849725 | 0.71607971607972 | 87.705801600272 | average | ||
| Crime | Criminal acts per 1,000 residents | number | 0.0079641990291262 | 0.032152995153139 | 0.079880916262136 | 87.705801600272 | average | ||
| Unemployment rate | percent | 0.061732605729877 | 0.047095452067673 | 0.63988219971336 | 87.705801600272 | average | |||
| Labor force participation rate | percent | 0.55123143448017 | 0.61374589071264 | 0.49440216056549 | 87.705801600272 | average | |||
| industry | county | Target Industries - Diversity | relative to county diversity | number | 0.0076575741169528 | 0.048480946595015 | 0.030063740621543 | 62.604207203038 | low |
| Target Industries - Employment Change, 1 Year | % change | percent | -0.10903786742778 | -0.054063603534816 | 0.61405596602577 | 62.604207203038 | low | ||
| Target Industries - Employment Change, 5 Years | % change | percent | -0.042598861686812 | -0.021846911546034 | 0.49709868647689 | 62.604207203038 | low | ||
| Related Industries - Diversity | relative to county diversity | number | 0.021384402991759 | 0.071509052995474 | 0.063878909279561 | 62.604207203038 | low | ||
| Related Industries - Employment Change, 1 Year | % change | percent | 0.062340400455447 | -0.02361410833971 | 0.68160667381903 | 62.604207203038 | low | ||
| Related Industries - Employment Change, 5 Years | % change | percent | -1 | -0.037060214673164 | 0 | 62.604207203038 | low | ||
| Target Industries - Employment | per 100,00 workers | number | 0.034447476125512 | 0.21299338245718 | 0.035204167546679 | 62.604207203038 | low | ||
| Target Industries - Income | average annual pay/MHI | number | 0.58049113233288 | 0.83593053070384 | 0.25703990227662 | 62.604207203038 | low | ||
| Related Industries - Employment | per 100,00 workers | number | 0.22978403463742 | 0.38864538870834 | 0.25327147900526 | 62.604207203038 | low | ||
| Related Industries - Income | average annual pay/MHI | number | 0.25635321873947 | 0.30736251703532 | 0.27671831276198 | 62.604207203038 | low | ||
| engagement | county | Decennial Census Participation | percent | 0.41 | 0.57375 | 0.34426229508197 | 68.211609246262 | average | |
| Management Diveristy | relative to regional diversity | number | 1.8358519465837 | 1.9021235388396 | 0.26323012688932 | 68.211609246262 | average | ||
| Sector Survey Partnerships | number | 1 | 0.40625 | 0.66666666666667 | 68.211609246262 | average | |||
| Completed Talent Gap Survey | number | 0.064009661835749 | 0.079886760824699 | 0.04545376689059 | 68.211609246262 | average | |||
| regional_context | region | Poverty | households living below the poverty line | percent | 0.1438553896891 | 0.083092833248716 | 0.18617844688537 | 17.777931143704 | low |
| Median Household Income | dollar | 38043 | 57007.9375 | 0 | 17.777931143704 | low | |||
| education_training | region | In-demand Occupations - Training Programs | programs per 100,000 residents | number | 0 | 4.4347320964544E-8 | 0 | 174.28698301625 | average |
| In-demand Occupations - Postsecondary Education Programs | programs per 100,000 residents | number | 0 | 7.6006736827312E-6 | 0 | 174.28698301625 | average | ||
| Opportunity Occupations - Training Programs | programs per 100,000 residents | number | 0.0004924948073917 | 0.00014929954550687 | 1 | 174.28698301625 | average | ||
| Opportunity Occupations - Postsecondary Education Programs | programs per 100,000 residents | number | 0.00040684353654097 | 0.00038785139598413 | 0.23670382980141 | 174.28698301625 | average | ||
| regional_job_opportunities | region | In-demand Occupations - Program completers | per 100,00 workers | number | 0 | 0 | 148.68886286218 | high | |
| Opportunity Occupations - Program completers | per 100,00 workers | number | 0.026701783687715 | 0.0050575085821559 | 1 | 148.68886286218 | high | ||
| In-demand Occupations - Job Openings | per 100,00 workers | number | 0.00028825560939433 | 0.00027291351906945 | 0.39997280842167 | 148.68886286218 | high | ||
| In-demand Occupations - Wages | median annual wages (bottom quartile)/MHI | number | 0.74395624490182 | 0.58812061720987 | 1 | 148.68886286218 | high | ||
| In-demand Occupations - Diversity | relative to regional diversity | number | 2.7713872310663 | 3.0176038430139 | 0.33934565933963 | 148.68886286218 | high | ||
| Opportunity Occupations - Job Openings | per 100,00 workers | number | 0.00030583096184998 | 0.00030772934015918 | 0.43539531896239 | 148.68886286218 | high | ||
| Opportunity Occupations - Wages | median annual wages (bottom quartile)/MHI | number | 0.71887613935415 | 0.5527573256027 | 1 | 148.68886286218 | high | ||
| Opportunity Occupations - Diversity | relative to regional diversity | number | 2.0562938908444 | 2.0802233709678 | 0.49489452704793 | 148.68886286218 | high | ||
| Automation Risk | local automation index risk for frontline occupations | number | 106.54406835124 | 105.894645296 | 0.48776551872559 | 148.68886286218 | high | ||
| not directly part of a score | Nonwhite county population | percent | 0.097694174757282 | 0.093467743953257 | 0.28983131965383 | ||||
| Population | number | 46701 | 573818.40625 | 0.0081763859396384 | |||||
| Labor force | number | 20978 | 319974.734375 | 0.0066692875327701 | |||||
| Nonwhite regional population | percent | 0.11212228460125 | 0.093467743953257 | 0.43163594720953 | |||||
| combined_score | county | 91.826226859438 | average |
| category | applies_to | indicator | sub-text | data_type | raw_data | raw_data_state_average | normalized_data | category_score | simplified_category_score |
|---|---|---|---|---|---|---|---|---|---|
| individual | county | High School Graduation Rate | percent | 0.87041149575441 | 0.91158384662974 | 0.41231224241108 | 89.348954558884 | average | |
| Credentials held | % of CC participants completing training with occupational certification, certification, or license | percent | 0.0068881685575364 | 0.0060053600924168 | 0.37196110210697 | 89.348954558884 | average | ||
| Training Completion Rate | for Connecting Colorado (CC) participants | percent | 0.67924528301887 | 0.69235591265914 | 0.67924528301887 | 89.348954558884 | average | ||
| neighborhood | county | Bachelors Degree of higher | % of population | percent | 0.24467668190725 | 0.31919195744088 | 0.29089537187374 | 89.679031827074 | average |
| Cost of Living | indexed to national average | number | 111.6 | 111.7078125 | 0.75150300601202 | 89.679031827074 | average | ||
| Absenteeism | Chronically absent/student body | percent | 0.13726513569937 | 0.14699662849725 | 0.66723603466818 | 89.679031827074 | average | ||
| Crime | Criminal acts per 1,000 residents | number | 0.048872180451128 | 0.032152995153139 | 0.49018796992481 | 89.679031827074 | average | ||
| Unemployment rate | percent | 0.087059754649782 | 0.047095452067673 | 0.44811884317931 | 89.679031827074 | average | |||
| Labor force participation rate | percent | 0.5537416456667 | 0.61374589071264 | 0.49953415129368 | 89.679031827074 | average | |||
| industry | county | Target Industries - Diversity | relative to county diversity | number | 0.036747314576292 | 0.048480946595015 | 0.14427045916723 | 74.869619265947 | average |
| Target Industries - Employment Change, 1 Year | % change | percent | -0.06357417066919 | -0.054063603534816 | 0.64538979404336 | 74.869619265947 | average | ||
| Target Industries - Employment Change, 5 Years | % change | percent | -0.057353243532089 | -0.021846911546034 | 0.48943796461062 | 74.869619265947 | average | ||
| Related Industries - Diversity | relative to county diversity | number | 0.020659418370793 | 0.071509052995474 | 0.061713254860797 | 74.869619265947 | average | ||
| Related Industries - Employment Change, 1 Year | % change | percent | -0.069553033748792 | -0.02361410833971 | 0.59698272000161 | 74.869619265947 | average | ||
| Related Industries - Employment Change, 5 Years | % change | percent | -0.4574513027043 | -0.037060214673164 | 0.37298962593167 | 74.869619265947 | average | ||
| Target Industries - Employment | per 100,00 workers | number | 0.073011476058567 | 0.21299338245718 | 0.074615284633076 | 74.869619265947 | average | ||
| Target Industries - Income | average annual pay/MHI | number | 0.82409972299169 | 0.83593053070384 | 0.46472826672503 | 74.869619265947 | average | ||
| Related Industries - Employment | per 100,00 workers | number | 0.22083343983505 | 0.38864538870834 | 0.24340599645704 | 74.869619265947 | average | ||
| Related Industries - Income | average annual pay/MHI | number | 0.17147362165478 | 0.30736251703532 | 0.14613939029704 | 74.869619265947 | average | ||
| engagement | county | Decennial Census Participation | percent | 0.56 | 0.57375 | 0.59016393442623 | 104.21831953059 | average | |
| Management Diveristy | relative to regional diversity | number | 2.1737649088718 | 1.9021235388396 | 0.33800415961247 | 104.21831953059 | average | ||
| Sector Survey Partnerships | number | 0 | 0.40625 | 0 | 104.21831953059 | average | |||
| Completed Talent Gap Survey | number | 0.030251141552511 | 0.079886760824699 | 0.020465762323169 | 104.21831953059 | average | |||
| regional_context | region | Poverty | households living below the poverty line | percent | 0.1438553896891 | 0.083092833248716 | 0.18617844688537 | 17.777931143704 | low |
| Median Household Income | dollar | 38043 | 57007.9375 | 0 | 17.777931143704 | low | |||
| education_training | region | In-demand Occupations - Training Programs | programs per 100,000 residents | number | 0 | 4.4347320964544E-8 | 0 | 174.28698301625 | average |
| In-demand Occupations - Postsecondary Education Programs | programs per 100,000 residents | number | 0 | 7.6006736827312E-6 | 0 | 174.28698301625 | average | ||
| Opportunity Occupations - Training Programs | programs per 100,000 residents | number | 0.0004924948073917 | 0.00014929954550687 | 1 | 174.28698301625 | average | ||
| Opportunity Occupations - Postsecondary Education Programs | programs per 100,000 residents | number | 0.00040684353654097 | 0.00038785139598413 | 0.23670382980141 | 174.28698301625 | average | ||
| regional_job_opportunities | region | In-demand Occupations - Program completers | per 100,00 workers | number | 0 | 0 | 148.68886286218 | high | |
| Opportunity Occupations - Program completers | per 100,00 workers | number | 0.026701783687715 | 0.0050575085821559 | 1 | 148.68886286218 | high | ||
| In-demand Occupations - Job Openings | per 100,00 workers | number | 0.00028825560939433 | 0.00027291351906945 | 0.39997280842167 | 148.68886286218 | high | ||
| In-demand Occupations - Wages | median annual wages (bottom quartile)/MHI | number | 0.74395624490182 | 0.58812061720987 | 1 | 148.68886286218 | high | ||
| In-demand Occupations - Diversity | relative to regional diversity | number | 2.7713872310663 | 3.0176038430139 | 0.33934565933963 | 148.68886286218 | high | ||
| Opportunity Occupations - Job Openings | per 100,00 workers | number | 0.00030583096184998 | 0.00030772934015918 | 0.43539531896239 | 148.68886286218 | high | ||
| Opportunity Occupations - Wages | median annual wages (bottom quartile)/MHI | number | 0.71887613935415 | 0.5527573256027 | 1 | 148.68886286218 | high | ||
| Opportunity Occupations - Diversity | relative to regional diversity | number | 2.0562938908444 | 2.0802233709678 | 0.49489452704793 | 148.68886286218 | high | ||
| Automation Risk | local automation index risk for frontline occupations | number | 106.54406835124 | 105.894645296 | 0.48776551872559 | 148.68886286218 | high | ||
| not directly part of a score | Nonwhite county population | percent | 0.084829721362229 | 0.093467743953257 | 0.24095357206639 | ||||
| Population | number | 46701 | 573818.40625 | 0.0081763859396384 | |||||
| Labor force | number | 20978 | 319974.734375 | 0.0066692875327701 | |||||
| Nonwhite regional population | percent | 0.11212228460125 | 0.093467743953257 | 0.43163594720953 | |||||
| combined_score | county | 99.838528886377 | average |
| category | applies_to | indicator | sub-text | data_type | raw_data | raw_data_state_average | normalized_data | category_score | simplified_category_score |
|---|---|---|---|---|---|---|---|---|---|
| individual | county | High School Graduation Rate | percent | 0.87968217934166 | 0.91158384662974 | 0.45937749230445 | 122.95128628384 | average | |
| Credentials held | % of CC participants completing training with occupational certification, certification, or license | percent | 0.013698630136986 | 0.0060053600924168 | 0.73972602739726 | 122.95128628384 | average | ||
| Training Completion Rate | for Connecting Colorado (CC) participants | percent | 0.81481481481481 | 0.69235591265914 | 0.81481481481481 | 122.95128628384 | average | ||
| neighborhood | county | Bachelors Degree of higher | % of population | percent | 0.2097994702989 | 0.31919195744088 | 0.22513542412736 | 74.483268666372 | low |
| Cost of Living | indexed to national average | number | 109.4 | 111.7078125 | 0.79559118236473 | 74.483268666372 | low | ||
| Absenteeism | Chronically absent/student body | percent | 0.096942094990241 | 0.14699662849725 | 0.76498886062972 | 74.483268666372 | low | ||
| Crime | Criminal acts per 1,000 residents | number | 0.0033218503937008 | 0.032152995153139 | 0.033318159448819 | 74.483268666372 | low | ||
| Unemployment rate | percent | 0.1046408513154 | 0.047095452067673 | 0.31500436910999 | 74.483268666372 | low | |||
| Labor force participation rate | percent | 0.54424066924067 | 0.61374589071264 | 0.48010991990285 | 74.483268666372 | low | |||
| industry | county | Target Industries - Diversity | relative to county diversity | number | 0.014788092030443 | 0.048480946595015 | 0.058058251386233 | 56.018626294761 | low |
| Target Industries - Employment Change, 1 Year | % change | percent | -0.11649284650901 | -0.054063603534816 | 0.60891795374212 | 56.018626294761 | low | ||
| Target Industries - Employment Change, 5 Years | % change | percent | -0.53142011358816 | -0.021846911546034 | 0.24329451545797 | 56.018626294761 | low | ||
| Related Industries - Diversity | relative to county diversity | number | 0.020917906902552 | 0.071509052995474 | 0.062485404800002 | 56.018626294761 | low | ||
| Related Industries - Employment Change, 1 Year | % change | percent | 0.1438365882248 | -0.02361410833971 | 0.73389532390763 | 56.018626294761 | low | ||
| Related Industries - Employment Change, 5 Years | % change | percent | -1 | -0.037060214673164 | 0 | 56.018626294761 | low | ||
| Target Industries - Employment | per 100,00 workers | number | 0.050842447531777 | 0.21299338245718 | 0.051959279538228 | 56.018626294761 | low | ||
| Target Industries - Income | average annual pay/MHI | number | 0.45137451965711 | 0.83593053070384 | 0.14696160808663 | 56.018626294761 | low | ||
| Related Industries - Employment | per 100,00 workers | number | 0.26669253223959 | 0.38864538870834 | 0.29395258981573 | 56.018626294761 | low | ||
| Related Industries - Income | average annual pay/MHI | number | 0.22237695377453 | 0.30736251703532 | 0.22444916657272 | 56.018626294761 | low | ||
| engagement | county | Decennial Census Participation | percent | 0.5 | 0.57375 | 0.49180327868852 | 76.914210185691 | average | |
| Management Diveristy | relative to regional diversity | number | 1.519352352215 | 1.9021235388396 | 0.19319448556338 | 76.914210185691 | average | ||
| Sector Survey Partnerships | number | 0 | 0.40625 | 0 | 76.914210185691 | average | |||
| Completed Talent Gap Survey | number | 0.073204419889503 | 0.079886760824699 | 0.052259712598987 | 76.914210185691 | average | |||
| regional_context | region | Poverty | households living below the poverty line | percent | 0.1438553896891 | 0.083092833248716 | 0.18617844688537 | 17.777931143704 | low |
| Median Household Income | dollar | 38043 | 57007.9375 | 0 | 17.777931143704 | low | |||
| education_training | region | In-demand Occupations - Training Programs | programs per 100,000 residents | number | 0 | 4.4347320964544E-8 | 0 | 174.28698301625 | average |
| In-demand Occupations - Postsecondary Education Programs | programs per 100,000 residents | number | 0 | 7.6006736827312E-6 | 0 | 174.28698301625 | average | ||
| Opportunity Occupations - Training Programs | programs per 100,000 residents | number | 0.0004924948073917 | 0.00014929954550687 | 1 | 174.28698301625 | average | ||
| Opportunity Occupations - Postsecondary Education Programs | programs per 100,000 residents | number | 0.00040684353654097 | 0.00038785139598413 | 0.23670382980141 | 174.28698301625 | average | ||
| regional_job_opportunities | region | In-demand Occupations - Program completers | per 100,00 workers | number | 0 | 0 | 148.68886286218 | high | |
| Opportunity Occupations - Program completers | per 100,00 workers | number | 0.026701783687715 | 0.0050575085821559 | 1 | 148.68886286218 | high | ||
| In-demand Occupations - Job Openings | per 100,00 workers | number | 0.00028825560939433 | 0.00027291351906945 | 0.39997280842167 | 148.68886286218 | high | ||
| In-demand Occupations - Wages | median annual wages (bottom quartile)/MHI | number | 0.74395624490182 | 0.58812061720987 | 1 | 148.68886286218 | high | ||
| In-demand Occupations - Diversity | relative to regional diversity | number | 2.7713872310663 | 3.0176038430139 | 0.33934565933963 | 148.68886286218 | high | ||
| Opportunity Occupations - Job Openings | per 100,00 workers | number | 0.00030583096184998 | 0.00030772934015918 | 0.43539531896239 | 148.68886286218 | high | ||
| Opportunity Occupations - Wages | median annual wages (bottom quartile)/MHI | number | 0.71887613935415 | 0.5527573256027 | 1 | 148.68886286218 | high | ||
| Opportunity Occupations - Diversity | relative to regional diversity | number | 2.0562938908444 | 2.0802233709678 | 0.49489452704793 | 148.68886286218 | high | ||
| Automation Risk | local automation index risk for frontline occupations | number | 106.54406835124 | 105.894645296 | 0.48776551872559 | 148.68886286218 | high | ||
| not directly part of a score | Nonwhite county population | percent | 0.11220472440945 | 0.093467743953257 | 0.34496331488703 | ||||
| Population | number | 46701 | 573818.40625 | 0.0081763859396384 | |||||
| Labor force | number | 20978 | 319974.734375 | 0.0066692875327701 | |||||
| Nonwhite regional population | percent | 0.11212228460125 | 0.093467743953257 | 0.43163594720953 | |||||
| combined_score | county | 95.874452636115 | average |
| category | applies_to | indicator | sub-text | data_type | raw_data | raw_data_state_average | normalized_data | category_score | simplified_category_score |
|---|---|---|---|---|---|---|---|---|---|
| individual | county | High School Graduation Rate | percent | 0.86859340887826 | 0.91158384662974 | 0.40308220965801 | 114.00631663849 | average | |
| Credentials held | % of CC participants completing training with occupational certification, certification, or license | percent | 0.011728395061728 | 0.0060053600924168 | 0.63333333333333 | 114.00631663849 | average | ||
| Training Completion Rate | for Connecting Colorado (CC) participants | percent | 0.83098591549296 | 0.69235591265914 | 0.83098591549296 | 114.00631663849 | average | ||
| neighborhood | county | Bachelors Degree of higher | % of population | percent | 0.25044183387046 | 0.31919195744088 | 0.30176539485919 | 99.676186295868 | average |
| Cost of Living | indexed to national average | number | 106.2 | 111.7078125 | 0.85971943887776 | 99.676186295868 | average | ||
| Absenteeism | Chronically absent/student body | percent | 0.14680287552024 | 0.14699662849725 | 0.64411424116305 | 99.676186295868 | average | ||
| Crime | Criminal acts per 1,000 residents | number | 0.067237846898864 | 0.032152995153139 | 0.6743956043956 | 99.676186295868 | average | ||
| Unemployment rate | percent | 0.092170725320765 | 0.047095452067673 | 0.40942136111711 | 99.676186295868 | average | |||
| Labor force participation rate | percent | 0.60725075528701 | 0.61374589071264 | 0.608930625948 | 99.676186295868 | average | |||
| industry | county | Target Industries - Diversity | relative to county diversity | number | 0.090049147646528 | 0.048480946595015 | 0.35353418415408 | 137.54819981359 | high |
| Target Industries - Employment Change, 1 Year | % change | percent | -0.035566317654322 | -0.054063603534816 | 0.66469295925163 | 137.54819981359 | high | ||
| Target Industries - Employment Change, 5 Years | % change | percent | -0.032603623351523 | -0.021846911546034 | 0.50228838142153 | 137.54819981359 | high | ||
| Related Industries - Diversity | relative to county diversity | number | 0.19469344087262 | 0.071509052995474 | 0.58158297202035 | 137.54819981359 | high | ||
| Related Industries - Employment Change, 1 Year | % change | percent | -0.0090253985974948 | -0.02361410833971 | 0.63581776764917 | 137.54819981359 | high | ||
| Related Industries - Employment Change, 5 Years | % change | percent | 0.16578809627096 | -0.037060214673164 | 0.80145223481518 | 137.54819981359 | high | ||
| Target Industries - Employment | per 100,00 workers | number | 0.27232259753862 | 0.21299338245718 | 0.27830457928372 | 137.54819981359 | high | ||
| Target Industries - Income | average annual pay/MHI | number | 1.130793401414 | 0.83593053070384 | 0.72619978661656 | 137.54819981359 | high | ||
| Related Industries - Employment | per 100,00 workers | number | 0.9072637611622 | 0.38864538870834 | 1 | 137.54819981359 | high | ||
| Related Industries - Income | average annual pay/MHI | number | 0.34166098266576 | 0.30736251703532 | 0.40795592785427 | 137.54819981359 | high | ||
| engagement | county | Decennial Census Participation | percent | 0.67 | 0.57375 | 0.77049180327869 | 114.18119475434 | average | |
| Management Diveristy | relative to regional diversity | number | 1.7598200078016 | 1.9021235388396 | 0.24640563267636 | 114.18119475434 | average | ||
| Sector Survey Partnerships | number | 0 | 0.40625 | 0 | 114.18119475434 | average | |||
| Completed Talent Gap Survey | number | 0.021650326797386 | 0.079886760824699 | 0.014099452526963 | 114.18119475434 | average | |||
| regional_context | region | Poverty | households living below the poverty line | percent | 0.1438553896891 | 0.083092833248716 | 0.18617844688537 | 17.777931143704 | low |
| Median Household Income | dollar | 38043 | 57007.9375 | 0 | 17.777931143704 | low | |||
| education_training | region | In-demand Occupations - Training Programs | programs per 100,000 residents | number | 0 | 4.4347320964544E-8 | 0 | 174.28698301625 | average |
| In-demand Occupations - Postsecondary Education Programs | programs per 100,000 residents | number | 0 | 7.6006736827312E-6 | 0 | 174.28698301625 | average | ||
| Opportunity Occupations - Training Programs | programs per 100,000 residents | number | 0.0004924948073917 | 0.00014929954550687 | 1 | 174.28698301625 | average | ||
| Opportunity Occupations - Postsecondary Education Programs | programs per 100,000 residents | number | 0.00040684353654097 | 0.00038785139598413 | 0.23670382980141 | 174.28698301625 | average | ||
| regional_job_opportunities | region | In-demand Occupations - Program completers | per 100,00 workers | number | 0 | 0 | 148.68886286218 | high | |
| Opportunity Occupations - Program completers | per 100,00 workers | number | 0.026701783687715 | 0.0050575085821559 | 1 | 148.68886286218 | high | ||
| In-demand Occupations - Job Openings | per 100,00 workers | number | 0.00028825560939433 | 0.00027291351906945 | 0.39997280842167 | 148.68886286218 | high | ||
| In-demand Occupations - Wages | median annual wages (bottom quartile)/MHI | number | 0.74395624490182 | 0.58812061720987 | 1 | 148.68886286218 | high | ||
| In-demand Occupations - Diversity | relative to regional diversity | number | 2.7713872310663 | 3.0176038430139 | 0.33934565933963 | 148.68886286218 | high | ||
| Opportunity Occupations - Job Openings | per 100,00 workers | number | 0.00030583096184998 | 0.00030772934015918 | 0.43539531896239 | 148.68886286218 | high | ||
| Opportunity Occupations - Wages | median annual wages (bottom quartile)/MHI | number | 0.71887613935415 | 0.5527573256027 | 1 | 148.68886286218 | high | ||
| Opportunity Occupations - Diversity | relative to regional diversity | number | 2.0562938908444 | 2.0802233709678 | 0.49489452704793 | 148.68886286218 | high | ||
| Automation Risk | local automation index risk for frontline occupations | number | 106.54406835124 | 105.894645296 | 0.48776551872559 | 148.68886286218 | high | ||
| not directly part of a score | Nonwhite county population | percent | 0.13590364437822 | 0.093467743953257 | 0.43500599239202 | ||||
| Population | number | 46701 | 573818.40625 | 0.0081763859396384 | |||||
| Labor force | number | 20978 | 319974.734375 | 0.0066692875327701 | |||||
| Nonwhite regional population | percent | 0.11212228460125 | 0.093467743953257 | 0.43163594720953 | |||||
| combined_score | county | 115.16652493206 | average |
| category | applies_to | indicator | sub-text | data_type | raw_data | raw_data_state_average | normalized_data | category_score | simplified_category_score |
|---|---|---|---|---|---|---|---|---|---|
| individual | county | High School Graduation Rate | percent | 0.80952380952381 | 0.91158384662974 | 0.10319866508936 | 101.6349393396 | average | |
| Credentials held | % of CC participants completing training with occupational certification, certification, or license | percent | 0.012251148545176 | 0.0060053600924168 | 0.66156202143951 | 101.6349393396 | average | ||
| Training Completion Rate | for Connecting Colorado (CC) participants | percent | 0.9 | 0.69235591265914 | 0.9 | 101.6349393396 | average | ||
| neighborhood | county | Bachelors Degree of higher | % of population | percent | 0.19298245614035 | 0.31919195744088 | 0.19342744286053 | 75.69437296608 | low |
| Cost of Living | indexed to national average | number | 107.7 | 111.7078125 | 0.82965931863728 | 75.69437296608 | low | ||
| Absenteeism | Chronically absent/student body | percent | 0.043137254901961 | 0.14699662849725 | 0.89542483660131 | 75.69437296608 | low | ||
| Crime | Criminal acts per 1,000 residents | number | 0.032152995153139 | 0 | 75.69437296608 | low | |||
| Unemployment rate | percent | 0.09597924773022 | 0.047095452067673 | 0.38058530685052 | 75.69437296608 | low | |||
| Labor force participation rate | percent | 0.48429648241206 | 0.61374589071264 | 0.35755727864976 | 75.69437296608 | low | |||
| industry | county | Target Industries - Diversity | relative to county diversity | number | 0.019437401575075 | 0.048480946595015 | 0.076311504189838 | 76.122738680729 | average |
| Target Industries - Employment Change, 1 Year | % change | percent | -0.034060669890121 | -0.054063603534816 | 0.66573065991089 | 76.122738680729 | average | ||
| Target Industries - Employment Change, 5 Years | % change | percent | -0.30214648856033 | -0.021846911546034 | 0.36233721687561 | 76.122738680729 | average | ||
| Related Industries - Diversity | relative to county diversity | number | 0.026028204461759 | 0.071509052995474 | 0.077750747222793 | 76.122738680729 | average | ||
| Related Industries - Employment Change, 1 Year | % change | percent | 0.12985123135598 | -0.02361410833971 | 0.72492219949907 | 76.122738680729 | average | ||
| Related Industries - Employment Change, 5 Years | % change | percent | -0.037060214673164 | 0.68747676990253 | 76.122738680729 | average | |||
| Target Industries - Employment | per 100,00 workers | number | 0.040856031128405 | 0.21299338245718 | 0.041753496247334 | 76.122738680729 | average | ||
| Target Industries - Income | average annual pay/MHI | number | 0.62710765239948 | 0.83593053070384 | 0.29678278976152 | 76.122738680729 | average | ||
| Related Industries - Employment | per 100,00 workers | number | 0.19414392593789 | 0.38864538870834 | 0.21398840585145 | 76.122738680729 | average | ||
| Related Industries - Income | average annual pay/MHI | number | 0.17193067441735 | 0.30736251703532 | 0.14684252107635 | 76.122738680729 | average | ||
| engagement | county | Decennial Census Participation | percent | 0.37 | 0.57375 | 0.27868852459016 | 59.175659299497 | low | |
| Management Diveristy | relative to regional diversity | number | 1.7685153268857 | 1.9021235388396 | 0.24832974967184 | 59.175659299497 | low | ||
| Sector Survey Partnerships | number | 0 | 0.40625 | 0 | 59.175659299497 | low | |||
| Completed Talent Gap Survey | number | 0.12740384615385 | 0.079886760824699 | 0.092378044198891 | 59.175659299497 | low | |||
| regional_context | region | Poverty | households living below the poverty line | percent | 0.1438553896891 | 0.083092833248716 | 0.18617844688537 | 17.777931143704 | low |
| Median Household Income | dollar | 38043 | 57007.9375 | 0 | 17.777931143704 | low | |||
| education_training | region | In-demand Occupations - Training Programs | programs per 100,000 residents | number | 0 | 4.4347320964544E-8 | 0 | 174.28698301625 | average |
| In-demand Occupations - Postsecondary Education Programs | programs per 100,000 residents | number | 0 | 7.6006736827312E-6 | 0 | 174.28698301625 | average | ||
| Opportunity Occupations - Training Programs | programs per 100,000 residents | number | 0.0004924948073917 | 0.00014929954550687 | 1 | 174.28698301625 | average | ||
| Opportunity Occupations - Postsecondary Education Programs | programs per 100,000 residents | number | 0.00040684353654097 | 0.00038785139598413 | 0.23670382980141 | 174.28698301625 | average | ||
| regional_job_opportunities | region | In-demand Occupations - Program completers | per 100,00 workers | number | 0 | 0 | 148.68886286218 | high | |
| Opportunity Occupations - Program completers | per 100,00 workers | number | 0.026701783687715 | 0.0050575085821559 | 1 | 148.68886286218 | high | ||
| In-demand Occupations - Job Openings | per 100,00 workers | number | 0.00028825560939433 | 0.00027291351906945 | 0.39997280842167 | 148.68886286218 | high | ||
| In-demand Occupations - Wages | median annual wages (bottom quartile)/MHI | number | 0.74395624490182 | 0.58812061720987 | 1 | 148.68886286218 | high | ||
| In-demand Occupations - Diversity | relative to regional diversity | number | 2.7713872310663 | 3.0176038430139 | 0.33934565933963 | 148.68886286218 | high | ||
| Opportunity Occupations - Job Openings | per 100,00 workers | number | 0.00030583096184998 | 0.00030772934015918 | 0.43539531896239 | 148.68886286218 | high | ||
| Opportunity Occupations - Wages | median annual wages (bottom quartile)/MHI | number | 0.71887613935415 | 0.5527573256027 | 1 | 148.68886286218 | high | ||
| Opportunity Occupations - Diversity | relative to regional diversity | number | 2.0562938908444 | 2.0802233709678 | 0.49489452704793 | 148.68886286218 | high | ||
| Automation Risk | local automation index risk for frontline occupations | number | 106.54406835124 | 105.894645296 | 0.48776551872559 | 148.68886286218 | high | ||
| not directly part of a score | Nonwhite county population | percent | 0.11588785046729 | 0.093467743953257 | 0.35895713959607 | ||||
| Population | number | 46701 | 573818.40625 | 0.0081763859396384 | |||||
| Labor force | number | 20978 | 319974.734375 | 0.0066692875327701 | |||||
| Nonwhite regional population | percent | 0.11212228460125 | 0.093467743953257 | 0.43163594720953 | |||||
| combined_score | county | 93.340212472578 | average |
| category | applies_to | indicator | sub-text | data_type | raw_data | raw_data_state_average | normalized_data | category_score | simplified_category_score |
|---|---|---|---|---|---|---|---|---|---|
| individual | county | High School Graduation Rate | percent | 0.92407975460123 | 0.91158384662974 | 0.68477435269622 | 118.32957819718 | average | |
| Credentials held | % of CC participants completing training with occupational certification, certification, or license | percent | 0.0056680161943319 | 0.0060053600924168 | 0.30607287449392 | 118.32957819718 | average | ||
| Training Completion Rate | for Connecting Colorado (CC) participants | percent | 0.94736842105263 | 0.69235591265914 | 0.94736842105263 | 118.32957819718 | average | ||
| neighborhood | county | Bachelors Degree of higher | % of population | percent | 0.21146472392638 | 0.31919195744088 | 0.22827521043703 | 102.74564373615 | average |
| Cost of Living | indexed to national average | number | 105.5 | 111.7078125 | 0.87374749498998 | 102.74564373615 | average | ||
| Absenteeism | Chronically absent/student body | percent | 0.063599458728011 | 0.14699662849725 | 0.8458194939927 | 102.74564373615 | average | ||
| Crime | Criminal acts per 1,000 residents | number | 0.046414133852373 | 0.032152995153139 | 0.4655337625393 | 102.74564373615 | average | ||
| Unemployment rate | percent | 0.031037093111279 | 0.047095452067673 | 0.8722918779164 | 102.74564373615 | average | |||
| Labor force participation rate | percent | 0.46612561750176 | 0.61374589071264 | 0.32040793012365 | 102.74564373615 | average | |||
| industry | county | Target Industries - Diversity | relative to county diversity | number | 0.015071120509047 | 0.048480946595015 | 0.059169425060728 | 77.073434312206 | average |
| Target Industries - Employment Change, 1 Year | % change | percent | 0.067153074413212 | -0.054063603534816 | 0.73548772506677 | 77.073434312206 | average | ||
| Target Industries - Employment Change, 5 Years | % change | percent | 0.052823135287626 | -0.021846911546034 | 0.54664338353101 | 77.073434312206 | average | ||
| Related Industries - Diversity | relative to county diversity | number | 0 | 0.071509052995474 | 0 | 77.073434312206 | average | ||
| Related Industries - Employment Change, 1 Year | % change | percent | -0.29772524986939 | -0.02361410833971 | 0.45058547744056 | 77.073434312206 | average | ||
| Related Industries - Employment Change, 5 Years | % change | percent | -0.68274893724864 | -0.037060214673164 | 0.21810273586845 | 77.073434312206 | average | ||
| Target Industries - Employment | per 100,00 workers | number | 0.17940953822861 | 0.21299338245718 | 0.18335054272945 | 77.073434312206 | average | ||
| Target Industries - Income | average annual pay/MHI | number | 0.64155942467827 | 0.83593053070384 | 0.30910363994109 | 77.073434312206 | average | ||
| Related Industries - Employment | per 100,00 workers | number | 0.52135721215617 | 0.38864538870834 | 0.57464789675752 | 77.073434312206 | average | ||
| Related Industries - Income | average annual pay/MHI | number | 0.24414872695807 | 0.30736251703532 | 0.25794290099304 | 77.073434312206 | average | ||
| engagement | county | Decennial Census Participation | percent | 0.42 | 0.57375 | 0.36065573770492 | 73.352598197245 | average | |
| Management Diveristy | relative to regional diversity | number | 1.9686788433081 | 1.9021235388396 | 0.29262231905304 | 73.352598197245 | average | ||
| Sector Survey Partnerships | number | 1.5 | 0.40625 | 1 | 73.352598197245 | average | |||
| Completed Talent Gap Survey | number | 0.051396648044693 | 0.079886760824699 | 0.036117633565566 | 73.352598197245 | average | |||
| regional_context | region | Poverty | households living below the poverty line | percent | 0.12071984822676 | 0.083092833248716 | 0.35425583692432 | 38.343582943623 | low |
| Median Household Income | dollar | 39977 | 57007.9375 | 0.047295314486941 | 38.343582943623 | low | |||
| education_training | region | In-demand Occupations - Training Programs | programs per 100,000 residents | number | 0 | 4.4347320964544E-8 | 0 | 281.8572706195 | high |
| In-demand Occupations - Postsecondary Education Programs | programs per 100,000 residents | number | 0.00014323227500597 | 7.6006736827312E-6 | 1 | 281.8572706195 | high | ||
| Opportunity Occupations - Training Programs | programs per 100,000 residents | number | 0 | 0.00014929954550687 | 0 | 281.8572706195 | high | ||
| Opportunity Occupations - Postsecondary Education Programs | programs per 100,000 residents | number | 0.0017187873000716 | 0.00038785139598413 | 1 | 281.8572706195 | high | ||
| regional_job_opportunities | region | In-demand Occupations - Program completers | per 100,00 workers | number | 0 | 0 | 114.08250170372 | average | |
| Opportunity Occupations - Program completers | per 100,00 workers | number | 0 | 0.0050575085821559 | 0 | 114.08250170372 | average | ||
| In-demand Occupations - Job Openings | per 100,00 workers | number | 0.00025611964428996 | 0.00027291351906945 | 0.27771026861992 | 114.08250170372 | average | ||
| In-demand Occupations - Wages | median annual wages (bottom quartile)/MHI | number | 0.71498930447007 | 0.58812061720987 | 0.89976733558028 | 114.08250170372 | average | ||
| In-demand Occupations - Diversity | relative to regional diversity | number | 2.9239788764568 | 3.0176038430139 | 0.40158736178036 | 114.08250170372 | average | ||
| Opportunity Occupations - Job Openings | per 100,00 workers | number | 0.00029255635191769 | 0.00030772934015918 | 0.38895090357999 | 114.08250170372 | average | ||
| Opportunity Occupations - Wages | median annual wages (bottom quartile)/MHI | number | 0.69673547665908 | 0.5527573256027 | 0.92901757128976 | 114.08250170372 | average | ||
| Opportunity Occupations - Diversity | relative to regional diversity | number | 1.9871699537822 | 2.0802233709678 | 0.44488639859281 | 114.08250170372 | average | ||
| Automation Risk | local automation index risk for frontline occupations | number | 106.00708534918 | 105.894645296 | 0.61510893666587 | 114.08250170372 | average | ||
| not directly part of a score | Nonwhite county population | percent | 0.080700703698158 | 0.093467743953257 | 0.22526560795544 | ||||
| Population | number | 20945 | 573818.40625 | 0 | |||||
| Labor force | number | 9001 | 319974.734375 | 0 | |||||
| Nonwhite regional population | percent | 0.11587958218695 | 0.093467743953257 | 0.45718289345718 | |||||
| combined_score | county | 115.11208710138 | average |
| category | applies_to | indicator | sub-text | data_type | raw_data | raw_data_state_average | normalized_data | category_score | simplified_category_score |
|---|---|---|---|---|---|---|---|---|---|
| individual | county | High School Graduation Rate | percent | 0.93599160545645 | 0.91158384662974 | 0.74524823597759 | 119.57936843987 | average | |
| Credentials held | % of CC participants completing training with occupational certification, certification, or license | percent | 0.0039525691699604 | 0.0060053600924168 | 0.21343873517786 | 119.57936843987 | average | ||
| Training Completion Rate | for Connecting Colorado (CC) participants | percent | 1 | 0.69235591265914 | 1 | 119.57936843987 | average | ||
| neighborhood | county | Bachelors Degree of higher | % of population | percent | 0.32528856243442 | 0.31919195744088 | 0.44288668100512 | 89.428781238627 | average |
| Cost of Living | indexed to national average | number | 107.6 | 111.7078125 | 0.83166332665331 | 89.428781238627 | average | ||
| Absenteeism | Chronically absent/student body | percent | 0.18251928020566 | 0.14699662849725 | 0.55752901768326 | 89.428781238627 | average | ||
| Crime | Criminal acts per 1,000 residents | number | 0.035594639865997 | 0.032152995153139 | 0.35701423785595 | 89.428781238627 | average | ||
| Unemployment rate | percent | 0.05686167304538 | 0.047095452067673 | 0.67676224507435 | 89.428781238627 | average | |||
| Labor force participation rate | percent | 0.44285714285714 | 0.61374589071264 | 0.27283679476432 | 89.428781238627 | average | |||
| industry | county | Target Industries - Diversity | relative to county diversity | number | 0 | 0.048480946595015 | 0 | 54.171683537071 | low |
| Target Industries - Employment Change, 1 Year | % change | percent | 0.071945697750272 | -0.054063603534816 | 0.73879082723627 | 54.171683537071 | low | ||
| Target Industries - Employment Change, 5 Years | % change | percent | -0.33343883476358 | -0.021846911546034 | 0.34608970726661 | 54.171683537071 | low | ||
| Related Industries - Diversity | relative to county diversity | number | 0 | 0.071509052995474 | 0 | 54.171683537071 | low | ||
| Related Industries - Employment Change, 1 Year | % change | percent | -0.15882862455102 | -0.02361410833971 | 0.53970273848736 | 54.171683537071 | low | ||
| Related Industries - Employment Change, 5 Years | % change | percent | -0.61181800755411 | -0.037060214673164 | 0.26686610230103 | 54.171683537071 | low | ||
| Target Industries - Employment | per 100,00 workers | number | 0.07545106615637 | 0.21299338245718 | 0.07710846405311 | 54.171683537071 | low | ||
| Target Industries - Income | average annual pay/MHI | number | 0.43794423182067 | 0.83593053070384 | 0.13551162388337 | 54.171683537071 | low | ||
| Related Industries - Employment | per 100,00 workers | number | 0.17807187635309 | 0.38864538870834 | 0.1962735468735 | 54.171683537071 | low | ||
| Related Industries - Income | average annual pay/MHI | number | 0.10489341541319 | 0.30736251703532 | 0.043712283110767 | 54.171683537071 | low | ||
| engagement | county | Decennial Census Participation | percent | 0.38 | 0.57375 | 0.29508196721311 | 52.689576075829 | low | |
| Management Diveristy | relative to regional diversity | number | 1.4333841058392 | 1.9021235388396 | 0.17417126602151 | 52.689576075829 | low | ||
| Sector Survey Partnerships | number | 0 | 0.40625 | 0 | 52.689576075829 | low | |||
| Completed Talent Gap Survey | number | 0.14193548387097 | 0.079886760824699 | 0.10313433999032 | 52.689576075829 | low | |||
| regional_context | region | Poverty | households living below the poverty line | percent | 0.084434611085284 | 0.083092833248716 | 0.61786444818643 | 91.221687670605 | average |
| Median Household Income | dollar | 51842 | 57007.9375 | 0.33744986794483 | 91.221687670605 | average | |||
| education_training | region | In-demand Occupations - Training Programs | programs per 100,000 residents | number | 0 | 4.4347320964544E-8 | 0 | 0 | low |
| In-demand Occupations - Postsecondary Education Programs | programs per 100,000 residents | number | 0 | 7.6006736827312E-6 | 0 | 0 | low | ||
| Opportunity Occupations - Training Programs | programs per 100,000 residents | number | 0 | 0.00014929954550687 | 0 | 0 | low | ||
| Opportunity Occupations - Postsecondary Education Programs | programs per 100,000 residents | number | 0 | 0.00038785139598413 | 0 | 0 | low | ||
| regional_job_opportunities | region | In-demand Occupations - Program completers | per 100,00 workers | number | 0 | 0 | 73.719074202173 | average | |
| Opportunity Occupations - Program completers | per 100,00 workers | number | 0 | 0.0050575085821559 | 0 | 73.719074202173 | average | ||
| In-demand Occupations - Job Openings | per 100,00 workers | number | 0.00028628813613513 | 0.00027291351906945 | 0.39248747923114 | 73.719074202173 | average | ||
| In-demand Occupations - Wages | median annual wages (bottom quartile)/MHI | number | 0.63633644482273 | 0.58812061720987 | 0.62760929716894 | 73.719074202173 | average | ||
| In-demand Occupations - Diversity | relative to regional diversity | number | 1.9394480249676 | 3.0176038430139 | 0 | 73.719074202173 | average | ||
| Opportunity Occupations - Job Openings | per 100,00 workers | number | 0.00033258602588992 | 0.00030772934015918 | 0.52900434508004 | 73.719074202173 | average | ||
| Opportunity Occupations - Wages | median annual wages (bottom quartile)/MHI | number | 0.57687190890398 | 0.5527573256027 | 0.54473787423149 | 73.719074202173 | average | ||
| Opportunity Occupations - Diversity | relative to regional diversity | number | 1.3722239366808 | 2.0802233709678 | 0 | 73.719074202173 | average | ||
| Automation Risk | local automation index risk for frontline occupations | number | 106.64783787638 | 105.894645296 | 0.4631569818459 | 73.719074202173 | average | ||
| not directly part of a score | Nonwhite county population | percent | 0.070142378559464 | 0.093467743953257 | 0.18514986146956 | ||||
| Population | number | 79405 | 573818.40625 | 0.018558453254824 | |||||
| Labor force | number | 30110 | 319974.734375 | 0.011754361737434 | |||||
| Nonwhite regional population | percent | 0.095418434279457 | 0.093467743953257 | 0.31806166767315 | |||||
| combined_score | county | 68.687167309167 | low |
| category | applies_to | indicator | sub-text | data_type | raw_data | raw_data_state_average | normalized_data | category_score | simplified_category_score |
|---|---|---|---|---|---|---|---|---|---|
| individual | county | High School Graduation Rate | percent | 0.87850289731167 | 0.91158384662974 | 0.45339053320769 | 87.468019110999 | average | |
| Credentials held | % of CC participants completing training with occupational certification, certification, or license | percent | 0.0027034333603676 | 0.0060053600924168 | 0.14598540145985 | 87.468019110999 | average | ||
| Training Completion Rate | for Connecting Colorado (CC) participants | percent | 0.83333333333333 | 0.69235591265914 | 0.83333333333333 | 87.468019110999 | average | ||
| neighborhood | county | Bachelors Degree of higher | % of population | percent | 0.19549729267598 | 0.31919195744088 | 0.19816909253799 | 83.4656698995 | low |
| Cost of Living | indexed to national average | number | 105.2 | 111.7078125 | 0.87975951903808 | 83.4656698995 | low | ||
| Absenteeism | Chronically absent/student body | percent | 0.26741996233522 | 0.14699662849725 | 0.35170918221766 | 83.4656698995 | low | ||
| Crime | Criminal acts per 1,000 residents | number | 0.055446516192345 | 0.032152995153139 | 0.55612855740922 | 83.4656698995 | low | ||
| Unemployment rate | percent | 0.080515804371757 | 0.047095452067673 | 0.49766606518502 | 83.4656698995 | low | |||
| Labor force participation rate | percent | 0.52754272440684 | 0.61374589071264 | 0.44597187664712 | 83.4656698995 | low | |||
| industry | county | Target Industries - Diversity | relative to county diversity | number | 0.057752479607189 | 0.048480946595015 | 0.22673702410763 | 117.79905490446 | average |
| Target Industries - Employment Change, 1 Year | % change | percent | 0.083482994773287 | -0.054063603534816 | 0.74674239533304 | 117.79905490446 | average | ||
| Target Industries - Employment Change, 5 Years | % change | percent | 0.92597800871015 | -0.021846911546034 | 1 | 117.79905490446 | average | ||
| Related Industries - Diversity | relative to county diversity | number | 0.066904765290241 | 0.071509052995474 | 0.19985610231872 | 117.79905490446 | average | ||
| Related Industries - Employment Change, 1 Year | % change | percent | 0.03724199198353 | -0.02361410833971 | 0.66550332059123 | 117.79905490446 | average | ||
| Related Industries - Employment Change, 5 Years | % change | percent | -0.10771051084153 | -0.037060214673164 | 0.61342829582464 | 117.79905490446 | average | ||
| Target Industries - Employment | per 100,00 workers | number | 0.22534989778267 | 0.21299338245718 | 0.23030005244108 | 117.79905490446 | average | ||
| Target Industries - Income | average annual pay/MHI | number | 0.79352099386696 | 0.83593053070384 | 0.43865838872257 | 117.79905490446 | average | ||
| Related Industries - Employment | per 100,00 workers | number | 0.54944958589409 | 0.38864538870834 | 0.60561174094538 | 117.79905490446 | average | ||
| Related Industries - Income | average annual pay/MHI | number | 0.31726753403133 | 0.30736251703532 | 0.3704290032777 | 117.79905490446 | average | ||
| engagement | county | Decennial Census Participation | percent | 0.55 | 0.57375 | 0.57377049180328 | 84.805983743594 | average | |
| Management Diveristy | relative to regional diversity | number | 1.4665550115848 | 1.9021235388396 | 0.18151138808987 | 84.805983743594 | average | ||
| Sector Survey Partnerships | number | 0 | 0.40625 | 0 | 84.805983743594 | average | |||
| Completed Talent Gap Survey | number | 0.015436241610738 | 0.079886760824699 | 0.0094997962706014 | 84.805983743594 | average | |||
| regional_context | region | Poverty | households living below the poverty line | percent | 0.12071984822676 | 0.083092833248716 | 0.35425583692432 | 38.343582943623 | low |
| Median Household Income | dollar | 39977 | 57007.9375 | 0.047295314486941 | 38.343582943623 | low | |||
| education_training | region | In-demand Occupations - Training Programs | programs per 100,000 residents | number | 0 | 4.4347320964544E-8 | 0 | 281.8572706195 | high |
| In-demand Occupations - Postsecondary Education Programs | programs per 100,000 residents | number | 0.00014323227500597 | 7.6006736827312E-6 | 1 | 281.8572706195 | high | ||
| Opportunity Occupations - Training Programs | programs per 100,000 residents | number | 0 | 0.00014929954550687 | 0 | 281.8572706195 | high | ||
| Opportunity Occupations - Postsecondary Education Programs | programs per 100,000 residents | number | 0.0017187873000716 | 0.00038785139598413 | 1 | 281.8572706195 | high | ||
| regional_job_opportunities | region | In-demand Occupations - Program completers | per 100,00 workers | number | 0 | 0 | 114.08250170372 | average | |
| Opportunity Occupations - Program completers | per 100,00 workers | number | 0 | 0.0050575085821559 | 0 | 114.08250170372 | average | ||
| In-demand Occupations - Job Openings | per 100,00 workers | number | 0.00025611964428996 | 0.00027291351906945 | 0.27771026861992 | 114.08250170372 | average | ||
| In-demand Occupations - Wages | median annual wages (bottom quartile)/MHI | number | 0.71498930447007 | 0.58812061720987 | 0.89976733558028 | 114.08250170372 | average | ||
| In-demand Occupations - Diversity | relative to regional diversity | number | 2.9239788764568 | 3.0176038430139 | 0.40158736178036 | 114.08250170372 | average | ||
| Opportunity Occupations - Job Openings | per 100,00 workers | number | 0.00029255635191769 | 0.00030772934015918 | 0.38895090357999 | 114.08250170372 | average | ||
| Opportunity Occupations - Wages | median annual wages (bottom quartile)/MHI | number | 0.69673547665908 | 0.5527573256027 | 0.92901757128976 | 114.08250170372 | average | ||
| Opportunity Occupations - Diversity | relative to regional diversity | number | 1.9871699537822 | 2.0802233709678 | 0.44488639859281 | 114.08250170372 | average | ||
| Automation Risk | local automation index risk for frontline occupations | number | 106.00708534918 | 105.894645296 | 0.61510893666587 | 114.08250170372 | average | ||
| not directly part of a score | Nonwhite county population | percent | 0.15105846067573 | 0.093467743953257 | 0.49258584152955 | ||||
| Population | number | 20945 | 573818.40625 | 0 | |||||
| Labor force | number | 9001 | 319974.734375 | 0 | |||||
| Nonwhite regional population | percent | 0.11587958218695 | 0.093467743953257 | 0.45718289345718 | |||||
| combined_score | county | 115.40315470363 | average |
| category | applies_to | indicator | sub-text | data_type | raw_data | raw_data_state_average | normalized_data | category_score | simplified_category_score |
|---|---|---|---|---|---|---|---|---|---|
| individual | county | High School Graduation Rate | percent | 0.89669942272948 | 0.91158384662974 | 0.54577034618694 | 97.878499451333 | average | |
| Credentials held | % of CC participants completing training with occupational certification, certification, or license | percent | 0.0031542938380203 | 0.0060053600924168 | 0.1703318672531 | 97.878499451333 | average | ||
| Training Completion Rate | for Connecting Colorado (CC) participants | percent | 0.88712871287129 | 0.69235591265914 | 0.88712871287129 | 97.878499451333 | average | ||
| neighborhood | county | Bachelors Degree of higher | % of population | percent | 0.21750319481779 | 0.31919195744088 | 0.23966056815272 | 92.988095667886 | average |
| Cost of Living | indexed to national average | number | 101.3 | 111.7078125 | 0.95791583166332 | 92.988095667886 | average | ||
| Absenteeism | Chronically absent/student body | percent | 0.23920881156352 | 0.14699662849725 | 0.42009985075509 | 92.988095667886 | average | ||
| Crime | Criminal acts per 1,000 residents | number | 0.058940126037763 | 0.032152995153139 | 0.59116946415876 | 92.988095667886 | average | ||
| Unemployment rate | percent | 0.074770753220211 | 0.047095452067673 | 0.54116445877698 | 92.988095667886 | average | |||
| Labor force participation rate | percent | 0.56062353482131 | 0.61374589071264 | 0.51360380070138 | 92.988095667886 | average | |||
| industry | county | Target Industries - Diversity | relative to county diversity | number | 0.20499051493577 | 0.048480946595015 | 0.80479556276996 | 153.73598413417 | high |
| Target Industries - Employment Change, 1 Year | % change | percent | 0.088855983034441 | -0.054063603534816 | 0.75044548817675 | 153.73598413417 | high | ||
| Target Industries - Employment Change, 5 Years | % change | percent | 0.13127288416766 | -0.021846911546034 | 0.5873758054617 | 153.73598413417 | high | ||
| Related Industries - Diversity | relative to county diversity | number | 0.32635069642662 | 0.071509052995474 | 0.97486595900723 | 153.73598413417 | high | ||
| Related Industries - Employment Change, 1 Year | % change | percent | 0.025311728744626 | -0.02361410833971 | 0.65784876180709 | 153.73598413417 | high | ||
| Related Industries - Employment Change, 5 Years | % change | percent | 0.11936402008839 | -0.037060214673164 | 0.76953676087548 | 153.73598413417 | high | ||
| Target Industries - Employment | per 100,00 workers | number | 0.19853712318821 | 0.21299338245718 | 0.20289829430427 | 153.73598413417 | high | ||
| Target Industries - Income | average annual pay/MHI | number | 0.88169252695835 | 0.83593053070384 | 0.51382897876266 | 153.73598413417 | high | ||
| Related Industries - Employment | per 100,00 workers | number | 0.54432699912361 | 0.38864538870834 | 0.59996554742397 | 153.73598413417 | high | ||
| Related Industries - Income | average annual pay/MHI | number | 0.59047182690851 | 0.30736251703532 | 0.79072697124644 | 153.73598413417 | high | ||
| engagement | county | Decennial Census Participation | percent | 0.72 | 0.57375 | 0.85245901639344 | 107.59907006479 | average | |
| Management Diveristy | relative to regional diversity | number | 1.1244875216983 | 1.9021235388396 | 0.10581803347836 | 107.59907006479 | average | ||
| Sector Survey Partnerships | number | 1 | 0.40625 | 0.66666666666667 | 107.59907006479 | average | |||
| Completed Talent Gap Survey | number | 0.0062041737168641 | 0.079886760824699 | 0.0026662338761793 | 107.59907006479 | average | |||
| regional_context | region | Poverty | households living below the poverty line | percent | 0.13904957164824 | 0.083092833248716 | 0.2210922333046 | 41.52095100402 | low |
| Median Household Income | dollar | 46783 | 57007.9375 | 0.2137337376504 | 41.52095100402 | low | |||
| education_training | region | In-demand Occupations - Training Programs | programs per 100,000 residents | number | 0 | 4.4347320964544E-8 | 0 | 171.60022248351 | average |
| In-demand Occupations - Postsecondary Education Programs | programs per 100,000 residents | number | 1.8074249014953E-5 | 7.6006736827312E-6 | 0.12618838187273 | 171.60022248351 | average | ||
| Opportunity Occupations - Training Programs | programs per 100,000 residents | number | 0.00037353447964237 | 0.00014929954550687 | 0.75845364059906 | 171.60022248351 | average | ||
| Opportunity Occupations - Postsecondary Education Programs | programs per 100,000 residents | number | 0.00057235121880686 | 0.00038785139598413 | 0.33299711883082 | 171.60022248351 | average | ||
| regional_job_opportunities | region | In-demand Occupations - Program completers | per 100,00 workers | number | 0 | 0 | 108.1820797049 | average | |
| Opportunity Occupations - Program completers | per 100,00 workers | number | 0.0068983383740406 | 0.0050575085821559 | 0.25834747426309 | 108.1820797049 | average | ||
| In-demand Occupations - Job Openings | per 100,00 workers | number | 0.00023449039603033 | 0.00027291351906945 | 0.19542094518944 | 108.1820797049 | average | ||
| In-demand Occupations - Wages | median annual wages (bottom quartile)/MHI | number | 0.67664579013744 | 0.58812061720987 | 0.76708944321432 | 108.1820797049 | average | ||
| In-demand Occupations - Diversity | relative to regional diversity | number | 2.269808410281 | 3.0176038430139 | 0.13475307083989 | 108.1820797049 | average | ||
| Opportunity Occupations - Job Openings | per 100,00 workers | number | 0.00031024878969752 | 0.00030772934015918 | 0.45085215217146 | 108.1820797049 | average | ||
| Opportunity Occupations - Wages | median annual wages (bottom quartile)/MHI | number | 0.65304715984011 | 0.5527573256027 | 0.78895388499536 | 108.1820797049 | average | ||
| Opportunity Occupations - Diversity | relative to regional diversity | number | 1.5968260438686 | 2.0802233709678 | 0.16248974674903 | 108.1820797049 | average | ||
| Automation Risk | local automation index risk for frontline occupations | number | 104.40742584783 | 105.894645296 | 0.99446192858887 | 108.1820797049 | average | ||
| not directly part of a score | Nonwhite county population | percent | 0.19571399308359 | 0.093467743953257 | 0.66225195748389 | ||||
| Population | number | 165982 | 573818.40625 | 0.046042805075607 | |||||
| Labor force | number | 74374 | 319974.734375 | 0.036402382389562 | |||||
| Nonwhite regional population | percent | 0.19571399308359 | 0.093467743953257 | 1 | |||||
| combined_score | county | 110.50070035866 | average |
| category | applies_to | indicator | sub-text | data_type | raw_data | raw_data_state_average | normalized_data | category_score | simplified_category_score |
|---|---|---|---|---|---|---|---|---|---|
| individual | county | High School Graduation Rate | percent | 0.94248587195736 | 0.91158384662974 | 0.77821821848886 | 117.31169010296 | average | |
| Credentials held | % of CC participants completing training with occupational certification, certification, or license | percent | 0.0073701629327902 | 0.0060053600924168 | 0.39798879837067 | 117.31169010296 | average | ||
| Training Completion Rate | for Connecting Colorado (CC) participants | percent | 0.74533582089552 | 0.69235591265914 | 0.74533582089552 | 117.31169010296 | average | ||
| neighborhood | county | Bachelors Degree of higher | % of population | percent | 0.38517633787864 | 0.31919195744088 | 0.55580330484774 | 111.36392367677 | average |
| Cost of Living | indexed to national average | number | 105 | 111.7078125 | 0.88376753507014 | 111.36392367677 | average | ||
| Absenteeism | Chronically absent/student body | percent | 0.20840293165161 | 0.14699662849725 | 0.49478077175367 | 111.36392367677 | average | ||
| Crime | Criminal acts per 1,000 residents | number | 0.051674311204709 | 0.032152995153139 | 0.51829334138323 | 111.36392367677 | average | ||
| Unemployment rate | percent | 0.053687701207852 | 0.047095452067673 | 0.70079382853579 | 111.36392367677 | average | |||
| Labor force participation rate | percent | 0.67875332698058 | 0.61374589071264 | 0.75511375864258 | 111.36392367677 | average | |||
| industry | county | Target Industries - Diversity | relative to county diversity | number | 0.20549081800664 | 0.048480946595015 | 0.80675975946267 | 144.63887179261 | high |
| Target Industries - Employment Change, 1 Year | % change | percent | -0.015035036136084 | -0.054063603534816 | 0.67884323056567 | 144.63887179261 | high | ||
| Target Industries - Employment Change, 5 Years | % change | percent | 0.063207930639668 | -0.021846911546034 | 0.55203534299528 | 144.63887179261 | high | ||
| Related Industries - Diversity | relative to county diversity | number | 0.26925660017755 | 0.071509052995474 | 0.8043160214617 | 144.63887179261 | high | ||
| Related Industries - Employment Change, 1 Year | % change | percent | 0.048956156941289 | -0.02361410833971 | 0.67301922887261 | 144.63887179261 | high | ||
| Related Industries - Employment Change, 5 Years | % change | percent | 0.1938015093677 | -0.037060214673164 | 0.82071080556488 | 144.63887179261 | high | ||
| Target Industries - Employment | per 100,00 workers | number | 0.18774020553122 | 0.21299338245718 | 0.19186420586192 | 144.63887179261 | high | ||
| Target Industries - Income | average annual pay/MHI | number | 0.82029869532593 | 0.83593053070384 | 0.46148770276548 | 144.63887179261 | high | ||
| Related Industries - Employment | per 100,00 workers | number | 0.39269461401217 | 0.38864538870834 | 0.43283401235946 | 144.63887179261 | high | ||
| Related Industries - Income | average annual pay/MHI | number | 0.62040612750226 | 0.30736251703532 | 0.83677795228932 | 144.63887179261 | high | ||
| engagement | county | Decennial Census Participation | percent | 0.76 | 0.57375 | 0.91803278688525 | 108.74968355539 | average | |
| Management Diveristy | relative to regional diversity | number | 0.87446073721435 | 1.9021235388396 | 0.050491623866628 | 108.74968355539 | average | ||
| Sector Survey Partnerships | number | 0 | 0.40625 | 0 | 108.74968355539 | average | |||
| Completed Talent Gap Survey | number | 0.0050927260497742 | 0.079886760824699 | 0.0018435420298343 | 108.74968355539 | average | |||
| regional_context | region | Poverty | households living below the poverty line | percent | 0.054927945498386 | 0.083092833248716 | 0.83222741646497 | 151.24123659018 | average |
| Median Household Income | dollar | 68779 | 57007.9375 | 0.75163846229091 | 151.24123659018 | average | |||
| education_training | region | In-demand Occupations - Training Programs | programs per 100,000 residents | number | 0 | 4.4347320964544E-8 | 0 | 65.15477048933 | average |
| In-demand Occupations - Postsecondary Education Programs | programs per 100,000 residents | number | 4.0465897364996E-6 | 7.6006736827312E-6 | 0.028251940676994 | 65.15477048933 | average | ||
| Opportunity Occupations - Training Programs | programs per 100,000 residents | number | 0.00011869996560399 | 0.00014929954550687 | 0.24101769972486 | 65.15477048933 | average | ||
| Opportunity Occupations - Postsecondary Education Programs | programs per 100,000 residents | number | 0.00033182035839296 | 0.00038785139598413 | 0.19305492795946 | 65.15477048933 | average | ||
| regional_job_opportunities | region | In-demand Occupations - Program completers | per 100,00 workers | number | 0 | 0 | 59.417203768588 | low | |
| Opportunity Occupations - Program completers | per 100,00 workers | number | 0.0098669346408314 | 0.0050575085821559 | 0.36952342795627 | 59.417203768588 | low | ||
| In-demand Occupations - Job Openings | per 100,00 workers | number | 0.00018312518894847 | 0.00027291351906945 | 0 | 59.417203768588 | low | ||
| In-demand Occupations - Wages | median annual wages (bottom quartile)/MHI | number | 0.4869230433708 | 0.58812061720987 | 0.11060256106486 | 59.417203768588 | low | ||
| In-demand Occupations - Diversity | relative to regional diversity | number | 2.1594588985097 | 3.0176038430139 | 0.089741815744161 | 59.417203768588 | low | ||
| Opportunity Occupations - Job Openings | per 100,00 workers | number | 0.00024783283115299 | 0.00030772934015918 | 0.23247491020963 | 59.417203768588 | low | ||
| Opportunity Occupations - Wages | median annual wages (bottom quartile)/MHI | number | 0.47519998473517 | 0.5527573256027 | 0.21878014620234 | 59.417203768588 | low | ||
| Opportunity Occupations - Diversity | relative to regional diversity | number | 1.7791864980049 | 2.0802233709678 | 0.29441951526575 | 59.417203768588 | low | ||
| Automation Risk | local automation index risk for frontline occupations | number | 105.45774206801 | 105.894645296 | 0.7453835464373 | 59.417203768588 | low | ||
| not directly part of a score | Nonwhite county population | percent | 0.20429944461454 | 0.093467743953257 | 0.69487188465587 | ||||
| Population | number | 741365 | 573818.40625 | 0.22870134953542 | |||||
| Labor force | number | 393891 | 319974.734375 | 0.21432262490506 | |||||
| Nonwhite regional population | percent | 0.10467194532876 | 0.093467743953257 | 0.38097894904001 | |||||
| combined_score | county | 108.2681971394 | average |
| category | applies_to | indicator | sub-text | data_type | raw_data | raw_data_state_average | normalized_data | category_score | simplified_category_score |
|---|---|---|---|---|---|---|---|---|---|
| individual | county | High School Graduation Rate | percent | 0.96725963112518 | 0.91158384662974 | 0.90398922070874 | 112.78228475771 | average | |
| Credentials held | % of CC participants completing training with occupational certification, certification, or license | percent | 0.0026548672566371 | 0.0060053600924168 | 0.1433628318584 | 112.78228475771 | average | ||
| Training Completion Rate | for Connecting Colorado (CC) participants | percent | 0.8 | 0.69235591265914 | 0.8 | 112.78228475771 | average | ||
| neighborhood | county | Bachelors Degree of higher | % of population | percent | 0.35817963549056 | 0.31919195744088 | 0.50490182343631 | 107.64039235142 | average |
| Cost of Living | indexed to national average | number | 112.4 | 111.7078125 | 0.73547094188377 | 107.64039235142 | average | ||
| Absenteeism | Chronically absent/student body | percent | 0.086021505376344 | 0.14699662849725 | 0.79146301726947 | 107.64039235142 | average | ||
| Crime | Criminal acts per 1,000 residents | number | 0.0041606719290742 | 0.032152995153139 | 0.041731539448614 | 107.64039235142 | average | ||
| Unemployment rate | percent | 0.020112287683889 | 0.047095452067673 | 0.95500854550749 | 107.64039235142 | average | |||
| Labor force participation rate | percent | 0.67590546642329 | 0.61374589071264 | 0.74929146207503 | 107.64039235142 | average | |||
| industry | county | Target Industries - Diversity | relative to county diversity | number | 0.013877628170981 | 0.048480946595015 | 0.054483757832777 | 67.141054409642 | low |
| Target Industries - Employment Change, 1 Year | % change | percent | -0.017583005762966 | -0.054063603534816 | 0.67708715598804 | 67.141054409642 | low | ||
| Target Industries - Employment Change, 5 Years | % change | percent | 0.047160988747564 | -0.021846911546034 | 0.54370350233067 | 67.141054409642 | low | ||
| Related Industries - Diversity | relative to county diversity | number | 0.026311714036724 | 0.071509052995474 | 0.078597639344405 | 67.141054409642 | low | ||
| Related Industries - Employment Change, 1 Year | % change | percent | -0.27995123029459 | -0.02361410833971 | 0.46198944019824 | 67.141054409642 | low | ||
| Related Industries - Employment Change, 5 Years | % change | percent | -0.10099943675967 | -0.037060214673164 | 0.61804200335702 | 67.141054409642 | low | ||
| Target Industries - Employment | per 100,00 workers | number | 0.054935683320304 | 0.21299338245718 | 0.056142429502026 | 67.141054409642 | low | ||
| Target Industries - Income | average annual pay/MHI | number | 0.28576504868169 | 0.83593053070384 | 0.0057713484531938 | 67.141054409642 | low | ||
| Related Industries - Employment | per 100,00 workers | number | 0.23312735007409 | 0.38864538870834 | 0.25695653243711 | 67.141054409642 | low | ||
| Related Industries - Income | average annual pay/MHI | number | 0.17559342642257 | 0.30736251703532 | 0.1524773052474 | 67.141054409642 | low | ||
| engagement | county | Decennial Census Participation | percent | 0.76 | 0.57375 | 0.91803278688525 | 130.26322899692 | average | |
| Management Diveristy | relative to regional diversity | number | 1.7403225879168 | 1.9021235388396 | 0.24209120595947 | 130.26322899692 | average | ||
| Sector Survey Partnerships | number | 1 | 0.40625 | 0.66666666666667 | 130.26322899692 | average | |||
| Completed Talent Gap Survey | number | 0.013049645390071 | 0.079886760824699 | 0.0077332414345994 | 130.26322899692 | average | |||
| regional_context | region | Poverty | households living below the poverty line | percent | 0.051507728121417 | 0.083092833248716 | 0.85707495292841 | 113.64558858286 | average |
| Median Household Income | dollar | 51663 | 57007.9375 | 0.33307248361538 | 113.64558858286 | average | |||
| education_training | region | In-demand Occupations - Training Programs | programs per 100,000 residents | number | 0 | 4.4347320964544E-8 | 0 | 0 | low |
| In-demand Occupations - Postsecondary Education Programs | programs per 100,000 residents | number | 0 | 7.6006736827312E-6 | 0 | 0 | low | ||
| Opportunity Occupations - Training Programs | programs per 100,000 residents | number | 0 | 0.00014929954550687 | 0 | 0 | low | ||
| Opportunity Occupations - Postsecondary Education Programs | programs per 100,000 residents | number | 0 | 0.00038785139598413 | 0 | 0 | low | ||
| regional_job_opportunities | region | In-demand Occupations - Program completers | per 100,00 workers | number | 0 | 0 | 71.369084819864 | average | |
| Opportunity Occupations - Program completers | per 100,00 workers | number | 0 | 0.0050575085821559 | 0 | 71.369084819864 | average | ||
| In-demand Occupations - Job Openings | per 100,00 workers | number | 0.00018905377783914 | 0.00027291351906945 | 0.022555548988795 | 71.369084819864 | average | ||
| In-demand Occupations - Wages | median annual wages (bottom quartile)/MHI | number | 0.57172897222093 | 0.58812061720987 | 0.40405171656908 | 71.369084819864 | average | ||
| In-demand Occupations - Diversity | relative to regional diversity | number | 2.6527665757534 | 3.0176038430139 | 0.29096062808572 | 71.369084819864 | average | ||
| Opportunity Occupations - Job Openings | per 100,00 workers | number | 0.00018138751740173 | 0.00030772934015918 | 0 | 71.369084819864 | average | ||
| Opportunity Occupations - Wages | median annual wages (bottom quartile)/MHI | number | 0.54445733715812 | 0.5527573256027 | 0.440817541773 | 71.369084819864 | average | ||
| Opportunity Occupations - Diversity | relative to regional diversity | number | 1.8755977430232 | 2.0802233709678 | 0.36416881095548 | 71.369084819864 | average | ||
| Automation Risk | local automation index risk for frontline occupations | number | 104.58255489981 | 105.894645296 | 0.95293075912158 | 71.369084819864 | average | ||
| not directly part of a score | Nonwhite county population | percent | 0.064354318155306 | 0.093467743953257 | 0.16315846029863 | ||||
| Population | number | 40775 | 573818.40625 | 0.0062951441676902 | |||||
| Labor force | number | 20173 | 319974.734375 | 0.0062210303344834 | |||||
| Nonwhite regional population | percent | 0.079533516570846 | 0.093467743953257 | 0.21005554636009 | |||||
| combined_score | county | 86.120233416916 | average |
| category | applies_to | indicator | sub-text | data_type | raw_data | raw_data_state_average | normalized_data | category_score | simplified_category_score |
|---|---|---|---|---|---|---|---|---|---|
| individual | county | High School Graduation Rate | percent | 0.90915715326694 | 0.91158384662974 | 0.60901554222152 | 37.180874218994 | low | |
| Credentials held | % of CC participants completing training with occupational certification, certification, or license | percent | 0 | 0.0060053600924168 | 0 | 37.180874218994 | low | ||
| Training Completion Rate | for Connecting Colorado (CC) participants | percent | 0 | 0.69235591265914 | 0 | 37.180874218994 | low | ||
| neighborhood | county | Bachelors Degree of higher | % of population | percent | 0.12581977167841 | 0.31919195744088 | 0.06679419389783 | 83.269001286097 | low |
| Cost of Living | indexed to national average | number | 107.2 | 111.7078125 | 0.83967935871744 | 83.269001286097 | low | ||
| Absenteeism | Chronically absent/student body | percent | 0.013736263736264 | 0.14699662849725 | 0.96669996669997 | 83.269001286097 | low | ||
| Crime | Criminal acts per 1,000 residents | number | 0.008952551477171 | 0.032152995153139 | 0.089794091316025 | 83.269001286097 | low | ||
| Unemployment rate | percent | 0.026623376623377 | 0.047095452067673 | 0.90571013163247 | 83.269001286097 | low | |||
| Labor force participation rate | percent | 0.33573141486811 | 0.61374589071264 | 0.053824049646039 | 83.269001286097 | low | |||
| industry | county | Target Industries - Diversity | relative to county diversity | number | 0.01353832693584 | 0.048480946595015 | 0.053151656547165 | 109.9549096447 | average |
| Target Industries - Employment Change, 1 Year | % change | percent | -0.098208076072269 | -0.054063603534816 | 0.62151991735384 | 109.9549096447 | average | ||
| Target Industries - Employment Change, 5 Years | % change | percent | -0.16554941219465 | -0.021846911546034 | 0.43326070392891 | 109.9549096447 | average | ||
| Related Industries - Diversity | relative to county diversity | number | 0 | 0.071509052995474 | 0 | 109.9549096447 | average | ||
| Related Industries - Employment Change, 1 Year | % change | percent | 0.045090353519672 | -0.02361410833971 | 0.67053889638152 | 109.9549096447 | average | ||
| Related Industries - Employment Change, 5 Years | % change | percent | 0.1706815440909 | -0.037060214673164 | 0.80481636651612 | 109.9549096447 | average | ||
| Target Industries - Employment | per 100,00 workers | number | 0.42142857142857 | 0.21299338245718 | 0.4306858936043 | 109.9549096447 | average | ||
| Target Industries - Income | average annual pay/MHI | number | 1.4519480519481 | 0.83593053070384 | 1 | 109.9549096447 | average | ||
| Related Industries - Employment | per 100,00 workers | number | 0.49260442676372 | 0.38864538870834 | 0.54295613673878 | 109.9549096447 | average | ||
| Related Industries - Income | average annual pay/MHI | number | 0.2070784017756 | 0.30736251703532 | 0.20091384708597 | 109.9549096447 | average | ||
| engagement | county | Decennial Census Participation | percent | 0.6 | 0.57375 | 0.65573770491803 | 86.708962554879 | average | |
| Management Diveristy | relative to regional diversity | number | 1.1727249264041 | 1.9021235388396 | 0.11649209952641 | 86.708962554879 | average | ||
| Sector Survey Partnerships | number | 0 | 0.40625 | 0 | 86.708962554879 | average | |||
| Completed Talent Gap Survey | number | 0.05609756097561 | 0.079886760824699 | 0.039597242055607 | 86.708962554879 | average | |||
| regional_context | region | Poverty | households living below the poverty line | percent | 0.051507728121417 | 0.083092833248716 | 0.85707495292841 | 113.64558858286 | average |
| Median Household Income | dollar | 51663 | 57007.9375 | 0.33307248361538 | 113.64558858286 | average | |||
| education_training | region | In-demand Occupations - Training Programs | programs per 100,000 residents | number | 0 | 4.4347320964544E-8 | 0 | 0 | low |
| In-demand Occupations - Postsecondary Education Programs | programs per 100,000 residents | number | 0 | 7.6006736827312E-6 | 0 | 0 | low | ||
| Opportunity Occupations - Training Programs | programs per 100,000 residents | number | 0 | 0.00014929954550687 | 0 | 0 | low | ||
| Opportunity Occupations - Postsecondary Education Programs | programs per 100,000 residents | number | 0 | 0.00038785139598413 | 0 | 0 | low | ||
| regional_job_opportunities | region | In-demand Occupations - Program completers | per 100,00 workers | number | 0 | 0 | 71.369084819864 | average | |
| Opportunity Occupations - Program completers | per 100,00 workers | number | 0 | 0.0050575085821559 | 0 | 71.369084819864 | average | ||
| In-demand Occupations - Job Openings | per 100,00 workers | number | 0.00018905377783914 | 0.00027291351906945 | 0.022555548988795 | 71.369084819864 | average | ||
| In-demand Occupations - Wages | median annual wages (bottom quartile)/MHI | number | 0.57172897222093 | 0.58812061720987 | 0.40405171656908 | 71.369084819864 | average | ||
| In-demand Occupations - Diversity | relative to regional diversity | number | 2.6527665757534 | 3.0176038430139 | 0.29096062808572 | 71.369084819864 | average | ||
| Opportunity Occupations - Job Openings | per 100,00 workers | number | 0.00018138751740173 | 0.00030772934015918 | 0 | 71.369084819864 | average | ||
| Opportunity Occupations - Wages | median annual wages (bottom quartile)/MHI | number | 0.54445733715812 | 0.5527573256027 | 0.440817541773 | 71.369084819864 | average | ||
| Opportunity Occupations - Diversity | relative to regional diversity | number | 1.8755977430232 | 2.0802233709678 | 0.36416881095548 | 71.369084819864 | average | ||
| Automation Risk | local automation index risk for frontline occupations | number | 104.58255489981 | 105.894645296 | 0.95293075912158 | 71.369084819864 | average | ||
| not directly part of a score | Nonwhite county population | percent | 0.10993733213966 | 0.093467743953257 | 0.33634848892893 | ||||
| Population | number | 40775 | 573818.40625 | 0.0062951441676902 | |||||
| Labor force | number | 20173 | 319974.734375 | 0.0062210303344834 | |||||
| Nonwhite regional population | percent | 0.079533516570846 | 0.093467743953257 | 0.21005554636009 | |||||
| combined_score | county | 71.732631586771 | low |
| category | applies_to | indicator | sub-text | data_type | raw_data | raw_data_state_average | normalized_data | category_score | simplified_category_score |
|---|---|---|---|---|---|---|---|---|---|
| individual | county | High School Graduation Rate | percent | 0.86093226886428 | 0.91158384662974 | 0.36418826339906 | 103.18461030595 | average | |
| Credentials held | % of CC participants completing training with occupational certification, certification, or license | percent | 0.0060362173038229 | 0.0060053600924168 | 0.32595573440644 | 103.18461030595 | average | ||
| Training Completion Rate | for Connecting Colorado (CC) participants | percent | 1 | 0.69235591265914 | 1 | 103.18461030595 | average | ||
| neighborhood | county | Bachelors Degree of higher | % of population | percent | 0.090394025238218 | 0.31919195744088 | 0 | 66.652146872283 | low |
| Cost of Living | indexed to national average | number | 99.2 | 111.7078125 | 1 | 66.652146872283 | low | ||
| Absenteeism | Chronically absent/student body | percent | 0.059496567505721 | 0.14699662849725 | 0.85576589695583 | 66.652146872283 | low | ||
| Crime | Criminal acts per 1,000 residents | number | 0.020855057351408 | 0.032152995153139 | 0.20917622523462 | 66.652146872283 | low | ||
| Unemployment rate | percent | 0.14624505928854 | 0.047095452067673 | 0 | 66.652146872283 | low | |||
| Labor force participation rate | percent | 0.44360023378141 | 0.61374589071264 | 0.27435600388665 | 66.652146872283 | low | |||
| industry | county | Target Industries - Diversity | relative to county diversity | number | 0.0035383228301792 | 0.048480946595015 | 0.013891503781373 | 81.462450489608 | average |
| Target Industries - Employment Change, 1 Year | % change | percent | 0.033738508177292 | -0.054063603534816 | 0.71245822358831 | 81.462450489608 | average | ||
| Target Industries - Employment Change, 5 Years | % change | percent | -0.35483142653303 | -0.021846911546034 | 0.33498231576333 | 81.462450489608 | average | ||
| Related Industries - Diversity | relative to county diversity | number | 0 | 0.071509052995474 | 0 | 81.462450489608 | average | ||
| Related Industries - Employment Change, 1 Year | % change | percent | -0.22710726100608 | -0.02361410833971 | 0.49589458220611 | 81.462450489608 | average | ||
| Related Industries - Employment Change, 5 Years | % change | percent | -0.037060214673164 | 0.68747676990253 | 81.462450489608 | average | |||
| Target Industries - Employment | per 100,00 workers | number | 0.036890645586298 | 0.21299338245718 | 0.037701004955871 | 81.462450489608 | average | ||
| Target Industries - Income | average annual pay/MHI | number | 0.47738252086078 | 0.83593053070384 | 0.1691347146177 | 81.462450489608 | average | ||
| Related Industries - Employment | per 100,00 workers | number | 0.36031802539457 | 0.38864538870834 | 0.39714804097653 | 81.462450489608 | average | ||
| Related Industries - Income | average annual pay/MHI | number | 0.51606740239706 | 0.30736251703532 | 0.67626307281822 | 81.462450489608 | average | ||
| engagement | county | Decennial Census Participation | percent | 0.63 | 0.57375 | 0.70491803278689 | 98.637461601471 | average | |
| Management Diveristy | relative to regional diversity | number | 1.4305627657623 | 1.9021235388396 | 0.17354695444197 | 98.637461601471 | average | ||
| Sector Survey Partnerships | number | 0 | 0.40625 | 0 | 98.637461601471 | average | |||
| Completed Talent Gap Survey | number | 0.14603174603175 | 0.079886760824699 | 0.1061663869143 | 98.637461601471 | average | |||
| regional_context | region | Poverty | households living below the poverty line | percent | 0.16948250810349 | 0.083092833248716 | 0 | 4.4531175314146 | low |
| Median Household Income | dollar | 39950 | 57007.9375 | 0.046635038638364 | 4.4531175314146 | low | |||
| education_training | region | In-demand Occupations - Training Programs | programs per 100,000 residents | number | 0 | 4.4347320964544E-8 | 0 | 145.73137662265 | average |
| In-demand Occupations - Postsecondary Education Programs | programs per 100,000 residents | number | 0 | 7.6006736827312E-6 | 0 | 145.73137662265 | average | ||
| Opportunity Occupations - Training Programs | programs per 100,000 residents | number | 0.00031986352489604 | 0.00014929954550687 | 0.64947593374653 | 145.73137662265 | average | ||
| Opportunity Occupations - Postsecondary Education Programs | programs per 100,000 residents | number | 0.00066105128478516 | 0.00038785139598413 | 0.38460330999514 | 145.73137662265 | average | ||
| regional_job_opportunities | region | In-demand Occupations - Program completers | per 100,00 workers | number | 0 | 0 | 144.3321870202 | high | |
| Opportunity Occupations - Program completers | per 100,00 workers | number | 0.0074848064825674 | 0.0050575085821559 | 0.28031110468515 | 144.3321870202 | high | ||
| In-demand Occupations - Job Openings | per 100,00 workers | number | 0.00025037152548427 | 0.00027291351906945 | 0.25584132514856 | 144.3321870202 | high | ||
| In-demand Occupations - Wages | median annual wages (bottom quartile)/MHI | number | 0.69095569461827 | 0.58812061720987 | 0.81660519573518 | 144.3321870202 | high | ||
| In-demand Occupations - Diversity | relative to regional diversity | number | 3.2577567495615 | 3.0176038430139 | 0.53773441626625 | 144.3321870202 | high | ||
| Opportunity Occupations - Job Openings | per 100,00 workers | number | 0.0002782000195544 | 0.00030772934015918 | 0.33872182211926 | 144.3321870202 | high | ||
| Opportunity Occupations - Wages | median annual wages (bottom quartile)/MHI | number | 0.68184300130413 | 0.5527573256027 | 0.88127265575763 | 144.3321870202 | high | ||
| Opportunity Occupations - Diversity | relative to regional diversity | number | 2.6104098622853 | 2.0802233709678 | 0.89577306285684 | 144.3321870202 | high | ||
| Automation Risk | local automation index risk for frontline occupations | number | 104.38407285275 | 105.894645296 | 1 | 144.3321870202 | high | ||
| not directly part of a score | Nonwhite county population | percent | 0.11400764685436 | 0.093467743953257 | 0.3518134145746 | ||||
| Population | number | 46895 | 573818.40625 | 0.0082379723223177 | |||||
| Labor force | number | 19560 | 319974.734375 | 0.0058796866542974 | |||||
| Nonwhite regional population | percent | 0.07495675795106 | 0.093467743953257 | 0.17893684900347 | |||||
| combined_score | county | 92.064764349082 | average |
| category | applies_to | indicator | sub-text | data_type | raw_data | raw_data_state_average | normalized_data | category_score | simplified_category_score |
|---|---|---|---|---|---|---|---|---|---|
| individual | county | High School Graduation Rate | percent | 0.8721265551619 | 0.91158384662974 | 0.42101922705099 | 89.090931074109 | average | |
| Credentials held | % of CC participants completing training with occupational certification, certification, or license | percent | 0.003452243958573 | 0.0060053600924168 | 0.18642117376294 | 89.090931074109 | average | ||
| Training Completion Rate | for Connecting Colorado (CC) participants | percent | 0.85185185185185 | 0.69235591265914 | 0.85185185185185 | 89.090931074109 | average | ||
| neighborhood | county | Bachelors Degree of higher | % of population | percent | 0.18604267941007 | 0.31919195744088 | 0.18034269972568 | 88.22686211058 | average |
| Cost of Living | indexed to national average | number | 104.5 | 111.7078125 | 0.8937875751503 | 88.22686211058 | average | ||
| Absenteeism | Chronically absent/student body | percent | 0.17417969947869 | 0.14699662849725 | 0.57774618308197 | 88.22686211058 | average | ||
| Crime | Criminal acts per 1,000 residents | number | 0.04539984684389 | 0.032152995153139 | 0.45536046384422 | 88.22686211058 | average | ||
| Unemployment rate | percent | 0.073415052062739 | 0.047095452067673 | 0.55142908845307 | 88.22686211058 | average | |||
| Labor force participation rate | percent | 0.52356635152853 | 0.61374589071264 | 0.4378423977998 | 88.22686211058 | average | |||
| industry | county | Target Industries - Diversity | relative to county diversity | number | 0.048480946595015 | 0 | 98.418455769909 | average | |
| Target Industries - Employment Change, 1 Year | % change | percent | -0.054063603534816 | 0.68920545955527 | 98.418455769909 | average | |||
| Target Industries - Employment Change, 5 Years | % change | percent | -0.021846911546034 | 0.51921672806104 | 98.418455769909 | average | |||
| Related Industries - Diversity | relative to county diversity | number | 0.071509052995474 | 0 | 98.418455769909 | average | |||
| Related Industries - Employment Change, 1 Year | % change | percent | -0.02361410833971 | 0.64160854047047 | 98.418455769909 | average | |||
| Related Industries - Employment Change, 5 Years | % change | percent | -0.037060214673164 | 0.68747676990253 | 98.418455769909 | average | |||
| Target Industries - Employment | per 100,00 workers | number | 0.16870963490181 | 0.21299338245718 | 0.17241559968521 | 98.418455769909 | average | ||
| Target Industries - Income | average annual pay/MHI | number | 0.81876894688283 | 0.83593053070384 | 0.46018351660642 | 98.418455769909 | average | ||
| Related Industries - Employment | per 100,00 workers | number | 0.80707511331185 | 0.38864538870834 | 0.8895705393082 | 98.418455769909 | average | ||
| Related Industries - Income | average annual pay/MHI | number | 0.20581744750573 | 0.30736251703532 | 0.19897399280423 | 98.418455769909 | average | ||
| engagement | county | Decennial Census Participation | percent | 0.72 | 0.57375 | 0.85245901639344 | 134.67009019394 | high | |
| Management Diveristy | relative to regional diversity | number | 2.2140226544886 | 1.9021235388396 | 0.34691247129051 | 134.67009019394 | high | ||
| Sector Survey Partnerships | number | 0 | 0.40625 | 0 | 134.67009019394 | high | |||
| Completed Talent Gap Survey | number | 0.017933723196881 | 0.079886760824699 | 0.011348428282846 | 134.67009019394 | high | |||
| regional_context | region | Poverty | households living below the poverty line | percent | 0.16948250810349 | 0.083092833248716 | 0 | 4.4531175314146 | low |
| Median Household Income | dollar | 39950 | 57007.9375 | 0.046635038638364 | 4.4531175314146 | low | |||
| education_training | region | In-demand Occupations - Training Programs | programs per 100,000 residents | number | 0 | 4.4347320964544E-8 | 0 | 145.73137662265 | average |
| In-demand Occupations - Postsecondary Education Programs | programs per 100,000 residents | number | 0 | 7.6006736827312E-6 | 0 | 145.73137662265 | average | ||
| Opportunity Occupations - Training Programs | programs per 100,000 residents | number | 0.00031986352489604 | 0.00014929954550687 | 0.64947593374653 | 145.73137662265 | average | ||
| Opportunity Occupations - Postsecondary Education Programs | programs per 100,000 residents | number | 0.00066105128478516 | 0.00038785139598413 | 0.38460330999514 | 145.73137662265 | average | ||
| regional_job_opportunities | region | In-demand Occupations - Program completers | per 100,00 workers | number | 0 | 0 | 144.3321870202 | high | |
| Opportunity Occupations - Program completers | per 100,00 workers | number | 0.0074848064825674 | 0.0050575085821559 | 0.28031110468515 | 144.3321870202 | high | ||
| In-demand Occupations - Job Openings | per 100,00 workers | number | 0.00025037152548427 | 0.00027291351906945 | 0.25584132514856 | 144.3321870202 | high | ||
| In-demand Occupations - Wages | median annual wages (bottom quartile)/MHI | number | 0.69095569461827 | 0.58812061720987 | 0.81660519573518 | 144.3321870202 | high | ||
| In-demand Occupations - Diversity | relative to regional diversity | number | 3.2577567495615 | 3.0176038430139 | 0.53773441626625 | 144.3321870202 | high | ||
| Opportunity Occupations - Job Openings | per 100,00 workers | number | 0.0002782000195544 | 0.00030772934015918 | 0.33872182211926 | 144.3321870202 | high | ||
| Opportunity Occupations - Wages | median annual wages (bottom quartile)/MHI | number | 0.68184300130413 | 0.5527573256027 | 0.88127265575763 | 144.3321870202 | high | ||
| Opportunity Occupations - Diversity | relative to regional diversity | number | 2.6104098622853 | 2.0802233709678 | 0.89577306285684 | 144.3321870202 | high | ||
| Automation Risk | local automation index risk for frontline occupations | number | 104.38407285275 | 105.894645296 | 1 | 144.3321870202 | high | ||
| not directly part of a score | Nonwhite county population | percent | 0.098621595011487 | 0.093467743953257 | 0.29335499933928 | ||||
| Population | number | 46895 | 573818.40625 | 0.0082379723223177 | |||||
| Labor force | number | 19560 | 319974.734375 | 0.0058796866542974 | |||||
| Nonwhite regional population | percent | 0.07495675795106 | 0.093467743953257 | 0.17893684900347 | |||||
| combined_score | county | 100.70328861754 | average |
| category | applies_to | indicator | sub-text | data_type | raw_data | raw_data_state_average | normalized_data | category_score | simplified_category_score |
|---|---|---|---|---|---|---|---|---|---|
| individual | county | High School Graduation Rate | percent | 0.89534436321662 | 0.91158384662974 | 0.53889100293327 | 118.89008047307 | average | |
| Credentials held | % of CC participants completing training with occupational certification, certification, or license | percent | 0.015898251192369 | 0.0060053600924168 | 0.85850556438792 | 118.89008047307 | average | ||
| Training Completion Rate | for Connecting Colorado (CC) participants | percent | 0.55 | 0.69235591265914 | 0.55 | 118.89008047307 | average | ||
| neighborhood | county | Bachelors Degree of higher | % of population | percent | 0.18699499807618 | 0.31919195744088 | 0.18213826831714 | 101.41769181117 | average |
| Cost of Living | indexed to national average | number | 111.2 | 111.7078125 | 0.75951903807615 | 101.41769181117 | average | ||
| Absenteeism | Chronically absent/student body | percent | 0.080532212885154 | 0.14699662849725 | 0.80477039300569 | 101.41769181117 | average | ||
| Crime | Criminal acts per 1,000 residents | number | 0.033839129850947 | 0.032152995153139 | 0.339406472405 | 101.41769181117 | average | ||
| Unemployment rate | percent | 0.035939643347051 | 0.047095452067673 | 0.83517244170345 | 101.41769181117 | average | |||
| Labor force participation rate | percent | 0.62169537779294 | 0.61374589071264 | 0.63846187382474 | 101.41769181117 | average | |||
| industry | county | Target Industries - Diversity | relative to county diversity | number | 0.017045552077415 | 0.048480946595015 | 0.066921070378139 | 93.473934758806 | average |
| Target Industries - Employment Change, 1 Year | % change | percent | -0.16855218693821 | -0.054063603534816 | 0.57303837209747 | 93.473934758806 | average | ||
| Target Industries - Employment Change, 5 Years | % change | percent | 0.11425538141377 | -0.021846911546034 | 0.57854003336206 | 93.473934758806 | average | ||
| Related Industries - Diversity | relative to county diversity | number | 0.02349281851831 | 0.071509052995474 | 0.070177111020153 | 93.473934758806 | average | ||
| Related Industries - Employment Change, 1 Year | % change | percent | -0.045134326113159 | -0.02361410833971 | 0.61264997136789 | 93.473934758806 | average | ||
| Related Industries - Employment Change, 5 Years | % change | percent | 0.021350252131997 | -0.037060214673164 | 0.70215457227484 | 93.473934758806 | average | ||
| Target Industries - Employment | per 100,00 workers | number | 0.16844993141289 | 0.21299338245718 | 0.17215019141255 | 93.473934758806 | average | ||
| Target Industries - Income | average annual pay/MHI | number | 0.81371742112483 | 0.83593053070384 | 0.45587684121451 | 93.473934758806 | average | ||
| Related Industries - Employment | per 100,00 workers | number | 0.40936324275399 | 0.38864538870834 | 0.45120643001281 | 93.473934758806 | average | ||
| Related Industries - Income | average annual pay/MHI | number | 0.31177734097955 | 0.30736251703532 | 0.36198288056448 | 93.473934758806 | average | ||
| engagement | county | Decennial Census Participation | percent | 0.64 | 0.57375 | 0.72131147540984 | 107.71572115935 | average | |
| Management Diveristy | relative to regional diversity | number | 1.7218541249653 | 1.9021235388396 | 0.23800446881942 | 107.71572115935 | average | ||
| Sector Survey Partnerships | number | 0 | 0.40625 | 0 | 107.71572115935 | average | |||
| Completed Talent Gap Survey | number | 0.030976430976431 | 0.079886760824699 | 0.021002620434412 | 107.71572115935 | average | |||
| regional_context | region | Poverty | households living below the poverty line | percent | 0.051507728121417 | 0.083092833248716 | 0.85707495292841 | 113.64558858286 | average |
| Median Household Income | dollar | 51663 | 57007.9375 | 0.33307248361538 | 113.64558858286 | average | |||
| education_training | region | In-demand Occupations - Training Programs | programs per 100,000 residents | number | 0 | 4.4347320964544E-8 | 0 | 0 | low |
| In-demand Occupations - Postsecondary Education Programs | programs per 100,000 residents | number | 0 | 7.6006736827312E-6 | 0 | 0 | low | ||
| Opportunity Occupations - Training Programs | programs per 100,000 residents | number | 0 | 0.00014929954550687 | 0 | 0 | low | ||
| Opportunity Occupations - Postsecondary Education Programs | programs per 100,000 residents | number | 0 | 0.00038785139598413 | 0 | 0 | low | ||
| regional_job_opportunities | region | In-demand Occupations - Program completers | per 100,00 workers | number | 0 | 0 | 71.369084819864 | average | |
| Opportunity Occupations - Program completers | per 100,00 workers | number | 0 | 0.0050575085821559 | 0 | 71.369084819864 | average | ||
| In-demand Occupations - Job Openings | per 100,00 workers | number | 0.00018905377783914 | 0.00027291351906945 | 0.022555548988795 | 71.369084819864 | average | ||
| In-demand Occupations - Wages | median annual wages (bottom quartile)/MHI | number | 0.57172897222093 | 0.58812061720987 | 0.40405171656908 | 71.369084819864 | average | ||
| In-demand Occupations - Diversity | relative to regional diversity | number | 2.6527665757534 | 3.0176038430139 | 0.29096062808572 | 71.369084819864 | average | ||
| Opportunity Occupations - Job Openings | per 100,00 workers | number | 0.00018138751740173 | 0.00030772934015918 | 0 | 71.369084819864 | average | ||
| Opportunity Occupations - Wages | median annual wages (bottom quartile)/MHI | number | 0.54445733715812 | 0.5527573256027 | 0.440817541773 | 71.369084819864 | average | ||
| Opportunity Occupations - Diversity | relative to regional diversity | number | 1.8755977430232 | 2.0802233709678 | 0.36416881095548 | 71.369084819864 | average | ||
| Automation Risk | local automation index risk for frontline occupations | number | 104.58255489981 | 105.894645296 | 0.95293075912158 | 71.369084819864 | average | ||
| not directly part of a score | Nonwhite county population | percent | 0.078689405129582 | 0.093467743953257 | 0.2176237952224 | ||||
| Population | number | 40775 | 573818.40625 | 0.0062951441676902 | |||||
| Labor force | number | 20173 | 319974.734375 | 0.0062210303344834 | |||||
| Nonwhite regional population | percent | 0.079533516570846 | 0.093467743953257 | 0.21005554636009 | |||||
| combined_score | county | 86.644585943588 | average |
| category | applies_to | indicator | sub-text | data_type | raw_data | raw_data_state_average | normalized_data | category_score | simplified_category_score |
|---|---|---|---|---|---|---|---|---|---|
| individual | county | High School Graduation Rate | percent | 0.91629297458894 | 0.91158384662974 | 0.6452425594154 | 130.96873271888 | high | |
| Credentials held | % of CC participants completing training with occupational certification, certification, or license | percent | 0.018518518518519 | 0.0060053600924168 | 1 | 130.96873271888 | high | ||
| Training Completion Rate | for Connecting Colorado (CC) participants | percent | 0.5 | 0.69235591265914 | 0.5 | 130.96873271888 | high | ||
| neighborhood | county | Bachelors Degree of higher | % of population | percent | 0.19207772795217 | 0.31919195744088 | 0.19172160470329 | 83.767099001386 | low |
| Cost of Living | indexed to national average | number | 118.1 | 111.7078125 | 0.62124248496994 | 83.767099001386 | low | ||
| Absenteeism | Chronically absent/student body | percent | 0.062068965517241 | 0.14699662849725 | 0.84952978056426 | 83.767099001386 | low | ||
| Crime | Criminal acts per 1,000 residents | number | 0.0093780848963475 | 0.032152995153139 | 0.094062191510365 | 83.767099001386 | low | ||
| Unemployment rate | percent | 0.074154852780807 | 0.047095452067673 | 0.54582772095167 | 83.767099001386 | low | |||
| Labor force participation rate | percent | 0.62127371273713 | 0.61374589071264 | 0.63759980247057 | 83.767099001386 | low | |||
| industry | county | Target Industries - Diversity | relative to county diversity | number | 0 | 0.048480946595015 | 0 | 52.802474412052 | low |
| Target Industries - Employment Change, 1 Year | % change | percent | -1 | -0.054063603534816 | 0 | 52.802474412052 | low | ||
| Target Industries - Employment Change, 5 Years | % change | percent | -1 | -0.021846911546034 | 0 | 52.802474412052 | low | ||
| Related Industries - Diversity | relative to county diversity | number | 0 | 0.071509052995474 | 0 | 52.802474412052 | low | ||
| Related Industries - Employment Change, 1 Year | % change | percent | -0.060868541259287 | -0.02361410833971 | 0.60255476455253 | 52.802474412052 | low | ||
| Related Industries - Employment Change, 5 Years | % change | percent | -0.30213427183783 | -0.037060214673164 | 0.47976647662261 | 52.802474412052 | low | ||
| Target Industries - Employment | per 100,00 workers | number | 0.063249727371865 | 0.21299338245718 | 0.06463910422836 | 52.802474412052 | low | ||
| Target Industries - Income | average annual pay/MHI | number | 0.77753544165758 | 0.83593053070384 | 0.42502991534159 | 52.802474412052 | low | ||
| Related Industries - Employment | per 100,00 workers | number | 0.29477987537902 | 0.38864538870834 | 0.32491088920096 | 52.802474412052 | low | ||
| Related Industries - Income | average annual pay/MHI | number | 0.32862886044056 | 0.30736251703532 | 0.38790728794497 | 52.802474412052 | low | ||
| engagement | county | Decennial Census Participation | percent | 0.56 | 0.57375 | 0.59016393442623 | 94.035247547713 | average | |
| Management Diveristy | relative to regional diversity | number | 1.7639238821153 | 1.9021235388396 | 0.24731374590808 | 94.035247547713 | average | ||
| Sector Survey Partnerships | number | 0 | 0.40625 | 0 | 94.035247547713 | average | |||
| Completed Talent Gap Survey | number | 0.1 | 0.079886760824699 | 0.072093759606085 | 94.035247547713 | average | |||
| regional_context | region | Poverty | households living below the poverty line | percent | 0.051507728121417 | 0.083092833248716 | 0.85707495292841 | 113.64558858286 | average |
| Median Household Income | dollar | 51663 | 57007.9375 | 0.33307248361538 | 113.64558858286 | average | |||
| education_training | region | In-demand Occupations - Training Programs | programs per 100,000 residents | number | 0 | 4.4347320964544E-8 | 0 | 0 | low |
| In-demand Occupations - Postsecondary Education Programs | programs per 100,000 residents | number | 0 | 7.6006736827312E-6 | 0 | 0 | low | ||
| Opportunity Occupations - Training Programs | programs per 100,000 residents | number | 0 | 0.00014929954550687 | 0 | 0 | low | ||
| Opportunity Occupations - Postsecondary Education Programs | programs per 100,000 residents | number | 0 | 0.00038785139598413 | 0 | 0 | low | ||
| regional_job_opportunities | region | In-demand Occupations - Program completers | per 100,00 workers | number | 0 | 0 | 71.369084819864 | average | |
| Opportunity Occupations - Program completers | per 100,00 workers | number | 0 | 0.0050575085821559 | 0 | 71.369084819864 | average | ||
| In-demand Occupations - Job Openings | per 100,00 workers | number | 0.00018905377783914 | 0.00027291351906945 | 0.022555548988795 | 71.369084819864 | average | ||
| In-demand Occupations - Wages | median annual wages (bottom quartile)/MHI | number | 0.57172897222093 | 0.58812061720987 | 0.40405171656908 | 71.369084819864 | average | ||
| In-demand Occupations - Diversity | relative to regional diversity | number | 2.6527665757534 | 3.0176038430139 | 0.29096062808572 | 71.369084819864 | average | ||
| Opportunity Occupations - Job Openings | per 100,00 workers | number | 0.00018138751740173 | 0.00030772934015918 | 0 | 71.369084819864 | average | ||
| Opportunity Occupations - Wages | median annual wages (bottom quartile)/MHI | number | 0.54445733715812 | 0.5527573256027 | 0.440817541773 | 71.369084819864 | average | ||
| Opportunity Occupations - Diversity | relative to regional diversity | number | 1.8755977430232 | 2.0802233709678 | 0.36416881095548 | 71.369084819864 | average | ||
| Automation Risk | local automation index risk for frontline occupations | number | 104.58255489981 | 105.894645296 | 0.95293075912158 | 71.369084819864 | average | ||
| not directly part of a score | Nonwhite county population | percent | 0.065153010858835 | 0.093467743953257 | 0.16619304709095 | ||||
| Population | number | 40775 | 573818.40625 | 0.0062951441676902 | |||||
| Labor force | number | 20173 | 319974.734375 | 0.0062210303344834 | |||||
| Nonwhite regional population | percent | 0.079533516570846 | 0.093467743953257 | 0.21005554636009 | |||||
| combined_score | county | 78.084032440394 | low |
| category | applies_to | indicator | sub-text | data_type | raw_data | raw_data_state_average | normalized_data | category_score | simplified_category_score |
|---|---|---|---|---|---|---|---|---|---|
| individual | county | High School Graduation Rate | percent | 0.95682730923695 | 0.91158384662974 | 0.85102658510408 | 113.00661783724 | average | |
| Credentials held | % of CC participants completing training with occupational certification, certification, or license | percent | 0 | 0.0060053600924168 | 0 | 113.00661783724 | average | ||
| Training Completion Rate | for Connecting Colorado (CC) participants | percent | 1 | 0.69235591265914 | 1 | 113.00661783724 | average | ||
| neighborhood | county | Bachelors Degree of higher | % of population | percent | 0.21385542168675 | 0.31919195744088 | 0.2327828001367 | 100.93990943901 | average |
| Cost of Living | indexed to national average | number | 116.4 | 111.7078125 | 0.65531062124248 | 100.93990943901 | average | ||
| Absenteeism | Chronically absent/student body | percent | 0.045801526717557 | 0.14699662849725 | 0.88896599583622 | 100.93990943901 | average | ||
| Crime | Criminal acts per 1,000 residents | number | 0.018804566823371 | 0.032152995153139 | 0.18860980523842 | 100.93990943901 | average | ||
| Unemployment rate | percent | 0.0278940027894 | 0.047095452067673 | 0.89608964338615 | 100.93990943901 | average | |||
| Labor force participation rate | percent | 0.64247311827957 | 0.61374589071264 | 0.68094083818518 | 100.93990943901 | average | |||
| industry | county | Target Industries - Diversity | relative to county diversity | number | 0.0021184898626132 | 0.048480946595015 | 0.0083172201491294 | 90.904548023358 | average |
| Target Industries - Employment Change, 1 Year | % change | percent | -0.45233205173123 | -0.054063603534816 | 0.37745573997027 | 90.904548023358 | average | ||
| Target Industries - Employment Change, 5 Years | % change | percent | 0.61366772645574 | -0.021846911546034 | 0.83784327710804 | 90.904548023358 | average | ||
| Related Industries - Diversity | relative to county diversity | number | 0 | 0.071509052995474 | 0 | 90.904548023358 | average | ||
| Related Industries - Employment Change, 1 Year | % change | percent | -0.02361410833971 | 0.64160854047047 | 90.904548023358 | average | |||
| Related Industries - Employment Change, 5 Years | % change | percent | -0.037060214673164 | 0.68747676990253 | 90.904548023358 | average | |||
| Target Industries - Employment | per 100,00 workers | number | 0.12691771269177 | 0.21299338245718 | 0.12970565407935 | 90.904548023358 | average | ||
| Target Industries - Income | average annual pay/MHI | number | 0.68200836820084 | 0.83593053070384 | 0.34358836357562 | 90.904548023358 | average | ||
| Related Industries - Employment | per 100,00 workers | number | 0.62247889258984 | 0.38864538870834 | 0.68610576023939 | 90.904548023358 | average | ||
| Related Industries - Income | average annual pay/MHI | number | 0.22040569360907 | 0.30736251703532 | 0.22141657644335 | 90.904548023358 | average | ||
| engagement | county | Decennial Census Participation | percent | 0.55 | 0.57375 | 0.57377049180328 | 132.20228470422 | average | |
| Management Diveristy | relative to regional diversity | number | 3.3741275675706 | 1.9021235388396 | 0.60362272633874 | 132.20228470422 | average | ||
| Sector Survey Partnerships | number | 0 | 0.40625 | 0 | 132.20228470422 | average | |||
| Completed Talent Gap Survey | number | 0.184 | 0.079886760824699 | 0.13427042985267 | 132.20228470422 | average | |||
| regional_context | region | Poverty | households living below the poverty line | percent | 0.16948250810349 | 0.083092833248716 | 0 | 4.4531175314146 | low |
| Median Household Income | dollar | 39950 | 57007.9375 | 0.046635038638364 | 4.4531175314146 | low | |||
| education_training | region | In-demand Occupations - Training Programs | programs per 100,000 residents | number | 0 | 4.4347320964544E-8 | 0 | 145.73137662265 | average |
| In-demand Occupations - Postsecondary Education Programs | programs per 100,000 residents | number | 0 | 7.6006736827312E-6 | 0 | 145.73137662265 | average | ||
| Opportunity Occupations - Training Programs | programs per 100,000 residents | number | 0.00031986352489604 | 0.00014929954550687 | 0.64947593374653 | 145.73137662265 | average | ||
| Opportunity Occupations - Postsecondary Education Programs | programs per 100,000 residents | number | 0.00066105128478516 | 0.00038785139598413 | 0.38460330999514 | 145.73137662265 | average | ||
| regional_job_opportunities | region | In-demand Occupations - Program completers | per 100,00 workers | number | 0 | 0 | 144.3321870202 | high | |
| Opportunity Occupations - Program completers | per 100,00 workers | number | 0.0074848064825674 | 0.0050575085821559 | 0.28031110468515 | 144.3321870202 | high | ||
| In-demand Occupations - Job Openings | per 100,00 workers | number | 0.00025037152548427 | 0.00027291351906945 | 0.25584132514856 | 144.3321870202 | high | ||
| In-demand Occupations - Wages | median annual wages (bottom quartile)/MHI | number | 0.69095569461827 | 0.58812061720987 | 0.81660519573518 | 144.3321870202 | high | ||
| In-demand Occupations - Diversity | relative to regional diversity | number | 3.2577567495615 | 3.0176038430139 | 0.53773441626625 | 144.3321870202 | high | ||
| Opportunity Occupations - Job Openings | per 100,00 workers | number | 0.0002782000195544 | 0.00030772934015918 | 0.33872182211926 | 144.3321870202 | high | ||
| Opportunity Occupations - Wages | median annual wages (bottom quartile)/MHI | number | 0.68184300130413 | 0.5527573256027 | 0.88127265575763 | 144.3321870202 | high | ||
| Opportunity Occupations - Diversity | relative to regional diversity | number | 2.6104098622853 | 2.0802233709678 | 0.89577306285684 | 144.3321870202 | high | ||
| Automation Risk | local automation index risk for frontline occupations | number | 104.38407285275 | 105.894645296 | 1 | 144.3321870202 | high | ||
| not directly part of a score | Nonwhite county population | percent | 0.037609133646743 | 0.093467743953257 | 0.061541676635519 | ||||
| Population | number | 46895 | 573818.40625 | 0.0082379723223177 | |||||
| Labor force | number | 19560 | 319974.734375 | 0.0058796866542974 | |||||
| Nonwhite regional population | percent | 0.07495675795106 | 0.093467743953257 | 0.17893684900347 | |||||
| combined_score | county | 104.51000588259 | average |
| category | applies_to | indicator | sub-text | data_type | raw_data | raw_data_state_average | normalized_data | category_score | simplified_category_score |
|---|---|---|---|---|---|---|---|---|---|
| individual | county | High School Graduation Rate | percent | 0.84759594177327 | 0.91158384662974 | 0.2964826232172 | 58.831389455124 | low | |
| Credentials held | % of CC participants completing training with occupational certification, certification, or license | percent | 0.0012437810945273 | 0.0060053600924168 | 0.067164179104474 | 58.831389455124 | low | ||
| Training Completion Rate | for Connecting Colorado (CC) participants | percent | 0.6 | 0.69235591265914 | 0.6 | 58.831389455124 | low | ||
| neighborhood | county | Bachelors Degree of higher | % of population | percent | 0.11402734891928 | 0.31919195744088 | 0.044559930644454 | 80.045854040403 | low |
| Cost of Living | indexed to national average | number | 105.2 | 111.7078125 | 0.87975951903808 | 80.045854040403 | low | ||
| Absenteeism | Chronically absent/student body | percent | 0.13672922252011 | 0.14699662849725 | 0.66853521813307 | 80.045854040403 | low | ||
| Crime | Criminal acts per 1,000 residents | number | 0.05443234836703 | 0.032152995153139 | 0.54595645412131 | 80.045854040403 | low | ||
| Unemployment rate | percent | 0.057679844458846 | 0.047095452067673 | 0.67056749741591 | 80.045854040403 | low | |||
| Labor force participation rate | percent | 0.30940445157409 | 0.61374589071264 | 0 | 80.045854040403 | low | |||
| industry | county | Target Industries - Diversity | relative to county diversity | number | 0.0046621251194528 | 0.048480946595015 | 0.018303566925472 | 82.673176669113 | average |
| Target Industries - Employment Change, 1 Year | % change | percent | -0.17336195449497 | -0.054063603534816 | 0.56972345403816 | 82.673176669113 | average | ||
| Target Industries - Employment Change, 5 Years | % change | percent | -0.11350796792509 | -0.021846911546034 | 0.46028149234612 | 82.673176669113 | average | ||
| Related Industries - Diversity | relative to county diversity | number | 0 | 0.071509052995474 | 0 | 82.673176669113 | average | ||
| Related Industries - Employment Change, 1 Year | % change | percent | 0.13088559497723 | -0.02361410833971 | 0.72558585603242 | 82.673176669113 | average | ||
| Related Industries - Employment Change, 5 Years | % change | percent | -0.3595544560493 | -0.037060214673164 | 0.4402914338537 | 82.673176669113 | average | ||
| Target Industries - Employment | per 100,00 workers | number | 0.050550874918989 | 0.21299338245718 | 0.051661302087712 | 82.673176669113 | average | ||
| Target Industries - Income | average annual pay/MHI | number | 0.73817239144524 | 0.83593053070384 | 0.39147096942678 | 82.673176669113 | average | ||
| Related Industries - Employment | per 100,00 workers | number | 0.25871628910464 | 0.38864538870834 | 0.28516105258434 | 82.673176669113 | average | ||
| Related Industries - Income | average annual pay/MHI | number | 0.48915453074434 | 0.30736251703532 | 0.63486026340875 | 82.673176669113 | average | ||
| engagement | county | Decennial Census Participation | percent | 0.75 | 0.57375 | 0.90163934426229 | 132.47694115824 | average | |
| Management Diveristy | relative to regional diversity | number | 1.903502462079 | 1.9021235388396 | 0.27819996357485 | 132.47694115824 | average | ||
| Sector Survey Partnerships | number | 0 | 0.40625 | 0 | 132.47694115824 | average | |||
| Completed Talent Gap Survey | number | 0.092929292929293 | 0.079886760824699 | 0.066860033154353 | 132.47694115824 | average | |||
| regional_context | region | Poverty | households living below the poverty line | percent | 0.16948250810349 | 0.083092833248716 | 0 | 4.4531175314146 | low |
| Median Household Income | dollar | 39950 | 57007.9375 | 0.046635038638364 | 4.4531175314146 | low | |||
| education_training | region | In-demand Occupations - Training Programs | programs per 100,000 residents | number | 0 | 4.4347320964544E-8 | 0 | 145.73137662265 | average |
| In-demand Occupations - Postsecondary Education Programs | programs per 100,000 residents | number | 0 | 7.6006736827312E-6 | 0 | 145.73137662265 | average | ||
| Opportunity Occupations - Training Programs | programs per 100,000 residents | number | 0.00031986352489604 | 0.00014929954550687 | 0.64947593374653 | 145.73137662265 | average | ||
| Opportunity Occupations - Postsecondary Education Programs | programs per 100,000 residents | number | 0.00066105128478516 | 0.00038785139598413 | 0.38460330999514 | 145.73137662265 | average | ||
| regional_job_opportunities | region | In-demand Occupations - Program completers | per 100,00 workers | number | 0 | 0 | 144.3321870202 | high | |
| Opportunity Occupations - Program completers | per 100,00 workers | number | 0.0074848064825674 | 0.0050575085821559 | 0.28031110468515 | 144.3321870202 | high | ||
| In-demand Occupations - Job Openings | per 100,00 workers | number | 0.00025037152548427 | 0.00027291351906945 | 0.25584132514856 | 144.3321870202 | high | ||
| In-demand Occupations - Wages | median annual wages (bottom quartile)/MHI | number | 0.69095569461827 | 0.58812061720987 | 0.81660519573518 | 144.3321870202 | high | ||
| In-demand Occupations - Diversity | relative to regional diversity | number | 3.2577567495615 | 3.0176038430139 | 0.53773441626625 | 144.3321870202 | high | ||
| Opportunity Occupations - Job Openings | per 100,00 workers | number | 0.0002782000195544 | 0.00030772934015918 | 0.33872182211926 | 144.3321870202 | high | ||
| Opportunity Occupations - Wages | median annual wages (bottom quartile)/MHI | number | 0.68184300130413 | 0.5527573256027 | 0.88127265575763 | 144.3321870202 | high | ||
| Opportunity Occupations - Diversity | relative to regional diversity | number | 2.6104098622853 | 2.0802233709678 | 0.89577306285684 | 144.3321870202 | high | ||
| Automation Risk | local automation index risk for frontline occupations | number | 104.38407285275 | 105.894645296 | 1 | 144.3321870202 | high | ||
| not directly part of a score | Nonwhite county population | percent | 0.086400552963539 | 0.093467743953257 | 0.24692185599991 | ||||
| Population | number | 46895 | 573818.40625 | 0.0082379723223177 | |||||
| Labor force | number | 19560 | 319974.734375 | 0.0058796866542974 | |||||
| Nonwhite regional population | percent | 0.07495675795106 | 0.093467743953257 | 0.17893684900347 | |||||
| combined_score | county | 92.649148928164 | average |
| category | applies_to | indicator | sub-text | data_type | raw_data | raw_data_state_average | normalized_data | category_score | simplified_category_score |
|---|---|---|---|---|---|---|---|---|---|
| individual | county | High School Graduation Rate | percent | 0.80499099562645 | 0.91158384662974 | 0.080186552035155 | 94.375372591875 | average | |
| Credentials held | % of CC participants completing training with occupational certification, certification, or license | percent | 0.011990407673861 | 0.0060053600924168 | 0.64748201438849 | 94.375372591875 | average | ||
| Training Completion Rate | for Connecting Colorado (CC) participants | percent | 0.81818181818182 | 0.69235591265914 | 0.81818181818182 | 94.375372591875 | average | ||
| neighborhood | county | Bachelors Degree of higher | % of population | percent | 0.18330331875482 | 0.31919195744088 | 0.17517771648189 | 92.885349839692 | average |
| Cost of Living | indexed to national average | number | 108.8 | 111.7078125 | 0.80761523046092 | 92.885349839692 | average | ||
| Absenteeism | Chronically absent/student body | percent | 0.1096884336321 | 0.14699662849725 | 0.73408864574037 | 92.885349839692 | average | ||
| Crime | Criminal acts per 1,000 residents | number | 0.016220262851439 | 0.032152995153139 | 0.16268923639993 | 92.885349839692 | average | ||
| Unemployment rate | percent | 0.048163548163548 | 0.047095452067673 | 0.74261970215202 | 92.885349839692 | average | |||
| Labor force participation rate | percent | 0.62138012703197 | 0.61374589071264 | 0.63781736072919 | 92.885349839692 | average | |||
| industry | county | Target Industries - Diversity | relative to county diversity | number | 0.047146056612207 | 0.048480946595015 | 0.18509606249584 | 103.71302025261 | average |
| Target Industries - Employment Change, 1 Year | % change | percent | 0.050734936137917 | -0.054063603534816 | 0.72417225453171 | 103.71302025261 | average | ||
| Target Industries - Employment Change, 5 Years | % change | percent | 0.097584681976634 | -0.021846911546034 | 0.56988432734582 | 103.71302025261 | average | ||
| Related Industries - Diversity | relative to county diversity | number | 0.035867101679241 | 0.071509052995474 | 0.10714123443951 | 103.71302025261 | average | ||
| Related Industries - Employment Change, 1 Year | % change | percent | 0.17888971993604 | -0.02361410833971 | 0.7563857125838 | 103.71302025261 | average | ||
| Related Industries - Employment Change, 5 Years | % change | percent | 0.086068047704312 | -0.037060214673164 | 0.74664655333011 | 103.71302025261 | average | ||
| Target Industries - Employment | per 100,00 workers | number | 0.18364518364518 | 0.21299338245718 | 0.18767923056626 | 103.71302025261 | average | ||
| Target Industries - Income | average annual pay/MHI | number | 0.80058905058905 | 0.83593053070384 | 0.44468425643302 | 103.71302025261 | average | ||
| Related Industries - Employment | per 100,00 workers | number | 0.45057915364863 | 0.38864538870834 | 0.49663523766389 | 103.71302025261 | average | ||
| Related Industries - Income | average annual pay/MHI | number | 0.25161344177061 | 0.30736251703532 | 0.26942663147962 | 103.71302025261 | average | ||
| engagement | county | Decennial Census Participation | percent | 0.67 | 0.57375 | 0.77049180327869 | 152.33712062768 | high | |
| Management Diveristy | relative to regional diversity | number | 3.2954925301085 | 1.9021235388396 | 0.58622221342391 | 152.33712062768 | high | ||
| Sector Survey Partnerships | number | 0 | 0.40625 | 0 | 152.33712062768 | high | |||
| Completed Talent Gap Survey | number | 0.023409669211196 | 0.079886760824699 | 0.015401715064038 | 152.33712062768 | high | |||
| regional_context | region | Poverty | households living below the poverty line | percent | 0.16948250810349 | 0.083092833248716 | 0 | 4.4531175314146 | low |
| Median Household Income | dollar | 39950 | 57007.9375 | 0.046635038638364 | 4.4531175314146 | low | |||
| education_training | region | In-demand Occupations - Training Programs | programs per 100,000 residents | number | 0 | 4.4347320964544E-8 | 0 | 145.73137662265 | average |
| In-demand Occupations - Postsecondary Education Programs | programs per 100,000 residents | number | 0 | 7.6006736827312E-6 | 0 | 145.73137662265 | average | ||
| Opportunity Occupations - Training Programs | programs per 100,000 residents | number | 0.00031986352489604 | 0.00014929954550687 | 0.64947593374653 | 145.73137662265 | average | ||
| Opportunity Occupations - Postsecondary Education Programs | programs per 100,000 residents | number | 0.00066105128478516 | 0.00038785139598413 | 0.38460330999514 | 145.73137662265 | average | ||
| regional_job_opportunities | region | In-demand Occupations - Program completers | per 100,00 workers | number | 0 | 0 | 144.3321870202 | high | |
| Opportunity Occupations - Program completers | per 100,00 workers | number | 0.0074848064825674 | 0.0050575085821559 | 0.28031110468515 | 144.3321870202 | high | ||
| In-demand Occupations - Job Openings | per 100,00 workers | number | 0.00025037152548427 | 0.00027291351906945 | 0.25584132514856 | 144.3321870202 | high | ||
| In-demand Occupations - Wages | median annual wages (bottom quartile)/MHI | number | 0.69095569461827 | 0.58812061720987 | 0.81660519573518 | 144.3321870202 | high | ||
| In-demand Occupations - Diversity | relative to regional diversity | number | 3.2577567495615 | 3.0176038430139 | 0.53773441626625 | 144.3321870202 | high | ||
| Opportunity Occupations - Job Openings | per 100,00 workers | number | 0.0002782000195544 | 0.00030772934015918 | 0.33872182211926 | 144.3321870202 | high | ||
| Opportunity Occupations - Wages | median annual wages (bottom quartile)/MHI | number | 0.68184300130413 | 0.5527573256027 | 0.88127265575763 | 144.3321870202 | high | ||
| Opportunity Occupations - Diversity | relative to regional diversity | number | 2.6104098622853 | 2.0802233709678 | 0.89577306285684 | 144.3321870202 | high | ||
| Automation Risk | local automation index risk for frontline occupations | number | 104.38407285275 | 105.894645296 | 1 | 144.3321870202 | high | ||
| not directly part of a score | Nonwhite county population | percent | 0.055814340375977 | 0.093467743953257 | 0.13071130801924 | ||||
| Population | number | 46895 | 573818.40625 | 0.0082379723223177 | |||||
| Labor force | number | 19560 | 319974.734375 | 0.0058796866542974 | |||||
| Nonwhite regional population | percent | 0.07495675795106 | 0.093467743953257 | 0.17893684900347 | |||||
| combined_score | county | 105.40393492659 | average |
| category | applies_to | indicator | sub-text | data_type | raw_data | raw_data_state_average | normalized_data | category_score | simplified_category_score |
|---|---|---|---|---|---|---|---|---|---|
| individual | county | High School Graduation Rate | percent | 0.86234662576687 | 0.91158384662974 | 0.37136864663967 | 97.968308425607 | average | |
| Credentials held | % of CC participants completing training with occupational certification, certification, or license | percent | 0.016666666666667 | 0.0060053600924168 | 0.9 | 97.968308425607 | average | ||
| Training Completion Rate | for Connecting Colorado (CC) participants | percent | 0.33333333333333 | 0.69235591265914 | 0.33333333333333 | 97.968308425607 | average | ||
| neighborhood | county | Bachelors Degree of higher | % of population | percent | 0.21395705521472 | 0.31919195744088 | 0.23297442713843 | 99.372769300176 | average |
| Cost of Living | indexed to national average | number | 111.6 | 111.7078125 | 0.75150300601202 | 99.372769300176 | average | ||
| Absenteeism | Chronically absent/student body | percent | 0.045454545454545 | 0.14699662849725 | 0.88980716253444 | 99.372769300176 | average | ||
| Crime | Criminal acts per 1,000 residents | number | 0.012356079752878 | 0.032152995153139 | 0.12393147992137 | 99.372769300176 | average | ||
| Unemployment rate | percent | 0.020432692307692 | 0.047095452067673 | 0.95258261646574 | 99.372769300176 | average | |||
| Labor force participation rate | percent | 0.57201787555861 | 0.61374589071264 | 0.53689891281436 | 99.372769300176 | average | |||
| industry | county | Target Industries - Diversity | relative to county diversity | number | 0 | 0.048480946595015 | 0 | 45.43486655923 | low |
| Target Industries - Employment Change, 1 Year | % change | percent | -0.13772231300671 | -0.054063603534816 | 0.59428648952847 | 45.43486655923 | low | ||
| Target Industries - Employment Change, 5 Years | % change | percent | -0.091505741520111 | -0.021846911546034 | 0.47170541635017 | 45.43486655923 | low | ||
| Related Industries - Diversity | relative to county diversity | number | 0 | 0.071509052995474 | 0 | 45.43486655923 | low | ||
| Related Industries - Employment Change, 1 Year | % change | percent | -1 | -0.02361410833971 | 0 | 45.43486655923 | low | ||
| Related Industries - Employment Change, 5 Years | % change | percent | -1 | -0.037060214673164 | 0 | 45.43486655923 | low | ||
| Target Industries - Employment | per 100,00 workers | number | 0.071514423076923 | 0.21299338245718 | 0.073085346596395 | 45.43486655923 | low | ||
| Target Industries - Income | average annual pay/MHI | number | 0.66826923076923 | 0.83593053070384 | 0.33187506982689 | 45.43486655923 | low | ||
| Related Industries - Employment | per 100,00 workers | number | 0.23139528401806 | 0.38864538870834 | 0.25504742272704 | 45.43486655923 | low | ||
| Related Industries - Income | average annual pay/MHI | number | 0.23248926919003 | 0.30736251703532 | 0.24000597051542 | 45.43486655923 | low | ||
| engagement | county | Decennial Census Participation | percent | 0.55 | 0.57375 | 0.57377049180328 | 98.828861571686 | average | |
| Management Diveristy | relative to regional diversity | number | 2.0309378085257 | 1.9021235388396 | 0.30639910308337 | 98.828861571686 | average | ||
| Sector Survey Partnerships | number | 0 | 0.40625 | 0 | 98.828861571686 | average | |||
| Completed Talent Gap Survey | number | 0.08 | 0.079886760824699 | 0.057289790499756 | 98.828861571686 | average | |||
| regional_context | region | Poverty | households living below the poverty line | percent | 0.16948250810349 | 0.083092833248716 | 0 | 4.4531175314146 | low |
| Median Household Income | dollar | 39950 | 57007.9375 | 0.046635038638364 | 4.4531175314146 | low | |||
| education_training | region | In-demand Occupations - Training Programs | programs per 100,000 residents | number | 0 | 4.4347320964544E-8 | 0 | 145.73137662265 | average |
| In-demand Occupations - Postsecondary Education Programs | programs per 100,000 residents | number | 0 | 7.6006736827312E-6 | 0 | 145.73137662265 | average | ||
| Opportunity Occupations - Training Programs | programs per 100,000 residents | number | 0.00031986352489604 | 0.00014929954550687 | 0.64947593374653 | 145.73137662265 | average | ||
| Opportunity Occupations - Postsecondary Education Programs | programs per 100,000 residents | number | 0.00066105128478516 | 0.00038785139598413 | 0.38460330999514 | 145.73137662265 | average | ||
| regional_job_opportunities | region | In-demand Occupations - Program completers | per 100,00 workers | number | 0 | 0 | 144.3321870202 | high | |
| Opportunity Occupations - Program completers | per 100,00 workers | number | 0.0074848064825674 | 0.0050575085821559 | 0.28031110468515 | 144.3321870202 | high | ||
| In-demand Occupations - Job Openings | per 100,00 workers | number | 0.00025037152548427 | 0.00027291351906945 | 0.25584132514856 | 144.3321870202 | high | ||
| In-demand Occupations - Wages | median annual wages (bottom quartile)/MHI | number | 0.69095569461827 | 0.58812061720987 | 0.81660519573518 | 144.3321870202 | high | ||
| In-demand Occupations - Diversity | relative to regional diversity | number | 3.2577567495615 | 3.0176038430139 | 0.53773441626625 | 144.3321870202 | high | ||
| Opportunity Occupations - Job Openings | per 100,00 workers | number | 0.0002782000195544 | 0.00030772934015918 | 0.33872182211926 | 144.3321870202 | high | ||
| Opportunity Occupations - Wages | median annual wages (bottom quartile)/MHI | number | 0.68184300130413 | 0.5527573256027 | 0.88127265575763 | 144.3321870202 | high | ||
| Opportunity Occupations - Diversity | relative to regional diversity | number | 2.6104098622853 | 2.0802233709678 | 0.89577306285684 | 144.3321870202 | high | ||
| Automation Risk | local automation index risk for frontline occupations | number | 104.38407285275 | 105.894645296 | 1 | 144.3321870202 | high | ||
| not directly part of a score | Nonwhite county population | percent | 0.057287278854254 | 0.093467743953257 | 0.13630765268638 | ||||
| Population | number | 46895 | 573818.40625 | 0.0082379723223177 | |||||
| Labor force | number | 19560 | 319974.734375 | 0.0058796866542974 | |||||
| Nonwhite regional population | percent | 0.07495675795106 | 0.093467743953257 | 0.17893684900347 | |||||
| combined_score | county | 90.874498147281 | average |
Individual Achievements
Individual Factors affecting economic ability
| Component | County Average | State Average |
|---|---|---|
Neighborhood Characteristics
Neighborhood level factors affecting economic mobility
| Component | County Average | State Average |
|---|---|---|
Industry Dynamics
Industry growth and employment opportunities
| Component | County Average | State Average |
|---|---|---|
Regional Job Opportunities
Regional Occupation mobility based on in-demand and opportunity occupations
| Component | County Average | State Average |
|---|---|---|
Regional Context
Other Regional Factors
| Component | County Average | State Average |
|---|---|---|
Regional Education & Training
Regional educational and training opportunities
| Component | County Average | State Average |
|---|---|---|
Leadership and Engagement
Civic engagement, sector partnerships and employer survey results
| Component | County Average | State Average |
|---|---|---|
Background
Background
The Empowerment Score was developed to measure the community and individual level indicators of economic mobility and is intended to be used as a tool by state and local decision makers to increase opportunities for individuals to improve their income and overall economic status.
In an effort to build on decades of experience working to promote economic mobility and advance frontline service workers, the Empowerment Score was piloted as part of Lives Empowered, a statewide initiative to upskill frontline service workers in the retail and hospitality sectors. Lives Empowered was made possible by a $4.1 million grant from Walmart.
Like all data sets, the score is intended to prompt questions and uncover additional insights about economic mobility factors. Each of the county and regional scores should be understood in context of additional factors that may lead to the score.

Frequently asked questions
The Empowerment Score was developed to measure the community and individual level indicators of economic mobility and is intended to be used as a tool by state and local decision makers to increase opportunities for individuals to improve their income and overall economic status.
Economic stability and mobility are the result of one’s personal endowments inherited (e.g., family income) and acquired (e.g., knowledge and education), individual actions (navigating the landscape, responding to opportunities and challenges), opportunities that are sought and presented, social, spatial, and institutional dynamics that are difficult to change, structural barriers and privileges related to work and learning. Indicators include the outcomes for an individual that result from their level of economic mobility (e.g., their employment and wages) and the outcomes for a region that result from the population’s economic mobility (e.g., area income and poverty levels).
The Empowerment Score aims to equip Coloradans to better understand the factors contributing to economic mobility so that they can proactively work to improve wages and other economic factors of residents. The score helps unpack the mystery of economic mobility, by representing the complex, interrelated social and economic dynamics with indicators that provide important context for the work of CWDC staff and partners.
Economic mobility is the ability of someone to change their income or wealth. It is measured over generation or a lifetime.
The Center for Regional Economic Competitiveness (CREC) and other CWDC partners conducted a literature review, quantitative analysis of workforce data, and met with stakeholders across the state to discuss the concept of economic mobility and identify the indicators that would be included in the score.
The Score was informed by an extensive review of the literature on economic mobility, occupational mobility, neighborhood indicators and opportunity mapping, industry dynamics and low-income worker training and advancement, and dynamics of the retail, hospitality, food and accommodations industry. An analysis of CWDC data identified that training was linked to employment and wage gains across demographic groups and identified industries that retail, accommodation, and food service workers were likely to enter after receiving training and intensive services. Stakeholders identified key barriers to stability and upward mobility and variation across regions, counties, and other key geographies.
The final Empowerment Score website aims to present information that is easy to understand, provokes questions about economic mobility, and inspires action to remove barriers to increasing income and wages for frontline workers.
The Empowerment Score provides a birds-eye view of the indicators of economic mobility for Colorado’s frontline workforce. Viewing the score on the map and in chart format helps understand the variation in the status of indicators across counties in Colorado.
Policymakers should use the Empowerment Score to consider the factors facilitating and impeding the results that they are seeking from the employment and training system. The score should provoke questions and suggest data sources for data-informed decision making.
Sector partnerships, Chambers of Commerce, Workforce Development Boards and other industry-led groups should use the Empowerment Score to focus employers on improving the education and training system, to suggest data sources that could be helpful for tracking key milestones, and to identify the information missing from the score that only employers can provide to drive strategy and assess progress.
CWDC staff and Talent Development Network partners should use the Empowerment Score to identify data sources to inform the continuous improvement of their programs. Each category and each individual variable is part of a larger story of economic mobility and each has the potential to provoke important questions about the county-level and regional context for economic mobility. The Empowerment Score can be used to introduce multi-stakeholder conversations and to invite new perspectives and partnerships that inform work with communities statewide as well as to identify opportunities for data sharing and data enhancements.
A county may be designated as a “leader” based on its Empowerment Score or based on a single Empowerment Score category. A leader designation based on the Empowerment Score means that, on average, based on the indicators included in the Score, the economic and social conditions in the county are more conducive to economic mobility than in other counties in the state. A leader designation in a single category means that category is a strength for the county.
Counties may also be designated as “on-track” or “opportunity” based on their overall Empowerment Score, suggesting that the economic and social conditions in the county are similarly or less conducive to economic mobility than in other counties in the state. An “on-track” or “opportunity” designation in a single category means that category is less supportive of economic mobility than in other counties in the state.
Green is for “leader”, blue is for “on-track”, gray is for “opportunity.” See leader, on-track, or opportunity above and the color key on the web page.
Many of the indicators used to create the score are evaluated relative to the size of the underlying labor market or population. For example, crime incidents, business counts, and employment measures are relative to the population size (divided by the size of the population or labor force and then included in the score).
Individual Achievements ( ) - The Individual Achievements has key indicators of individual economic mobility. The indicators in this category include training completed and credentials gained by Connecting Colorado participants as well as the high school graduation rate.
Neighborhood Characteristics (
) - The Individual Achievements has key indicators of individual economic mobility. The indicators in this category include training completed and credentials gained by Connecting Colorado participants as well as the high school graduation rate.
Neighborhood Characteristics ( ) - The Neighborhood Characteristics category has neighborhood-level indicators of economic mobility. The indicators are bachelor’s degree attainment and high school absenteeism rates, crime, unemployment, labor force participation, and cost of living.
Leadership and engagement (
) - The Neighborhood Characteristics category has neighborhood-level indicators of economic mobility. The indicators are bachelor’s degree attainment and high school absenteeism rates, crime, unemployment, labor force participation, and cost of living.
Leadership and engagement ( ) - This category measures a few indicators of local leadership and engagement: employers’ participation in sector partnerships and Bridging the Talent Gap survey; the racial diversity in management occupations, and the participation rates for the decennial Census.
Industry dynamics (
) - This category measures a few indicators of local leadership and engagement: employers’ participation in sector partnerships and Bridging the Talent Gap survey; the racial diversity in management occupations, and the participation rates for the decennial Census.
Industry dynamics ( ) - Industry growth and industry diversity for retail, accommodation, food service, and recreation sectors, as well as industries offering related employment opportunities.
Regional context (
) - Industry growth and industry diversity for retail, accommodation, food service, and recreation sectors, as well as industries offering related employment opportunities.
Regional context ( ) - Two measures are included here. If workers are upwardly mobile, regions should have high median household income and a low percent of households below the poverty line.
Regional education and training (
) - Two measures are included here. If workers are upwardly mobile, regions should have high median household income and a low percent of households below the poverty line.
Regional education and training ( ) - Education and training opportunities at a regional level are key to education and upskilling. This category measures the availability of providers and programs in subject areas related to in-demand and opportunity occupations.
Opportunity jobs (
) - Education and training opportunities at a regional level are key to education and upskilling. This category measures the availability of providers and programs in subject areas related to in-demand and opportunity occupations.
Opportunity jobs ( ) - This category measures the number and character of in-demand and opportunity occupations including job openings, wages, and demographic diversity.
These categories and the data points within them were chosen after a rigorous review of the literature, data analysis, and stakeholder insights. See more detail in “How was the empowerment score created?” above.
The Empowerment Score includes data points from a variety of data sources and is updated at least once per year. Data points are created from the American Community Survey (updated annually by the U.S. Census Bureau), the Integrated Postsecondary Education Data System (updated annually by the National Center for Education Statistics), the Eligible Training Provider List (updated several times a year by CWDC), Connecting Colorado database (updated annually by CWDC), Quarterly Census of Employment and Wages (updated annually by US BLS), FBI Crime Data (updated four times a year at www.fbi.gov/services/cjis/ucr/nibrs), Economic Modeling Service (updated several times a year, available through subscription).
Though many of these data sets are updated annually, the updates are often for the previous year at the most recent. More timely data on employment and other indicators will need to be acquired from local stakeholders. In fact, any information should be validated by local employers and stakeholders before conclusions are drawn.
A consistent finding from related research and stakeholder insights is the importance of housing, healthcare, childcare and dependent care, and transportation availability, quality, and cost. Some of these costs, including food, housing, utilities, transportation, and health care, are captured in the Cost of Living measure included in the Neighborhood Characteristics category of the Score. However, the data is very limited on housing and transportation and even more limited for childcare.
Center for Regional Economic Competitiveness (CREC) and contributing partners examined alternative measures of these costs and barriers to work and learning. Produced for Colorado in 2018, the Self-Sufficiency Standard at the Center for Women’s Welfare, University of Washington includes detailed estimates of housing and childcare costs for families of different sizes at the county level based on local data collection, but there is no consistent funding of this data collection effort. http://www.selfsufficiencystandard.org/
Education data is reported by Colorado community colleges and universities at their headquarters location and it is difficult to know how many programs are available at extension schools and satellite campuses. A region may look like there are no regional completions when in reality there may be programs offered at these other campuses. Schools would have to find a way to address this reporting issue in order to accurately identify training opportunities across counties and regions.
Some of these programs may be captured through the Connecting Colorado system and through the Eligible Training Providers list and counted in the Regional Education and Training category.
Labor markets and commuting shed areas are critical geographies in which to measure economic mobility. We include measures in the score that are calculated at the level of the “region”, which is defined here by the Office of Economic Development and International Trade (OEDIT) https://choosecolorado.com/doing-business/regions/
The Colorado Workforce Development Council (CWDC) website has a wealth of resources to support economic mobility and upskilling, reskilling and nextskilling opportunities for workers. Additional resources include:
- Your local workforce center- Workforce centers are located throughout Colorado and provide a wealth of information and resources for businesses and job seekers looking to increase training and find work
- My Colorado Journey- a free statewide platform connecting Coloradans to work, education and support services to plan and advance their learning and career journeys
- Local Community Colleges, AIMS, Colorado Mountain College- research demonstrates attaining additional education is a key approach to improving economic mobility. Community colleges provide a variety of industry relevant opportunities to develop skills, knowledge and experience that can lead to better paying jobs
- Lives Empowered- information and resources connected to Colorado’s statewide initiative to upskill frontline workers in retail and hospitality